
 Yahoo Finance
 Is C3is Inc. (NASDAQ:CISS) A High Quality Stock To Own?
While some investors are already well versed in financial metrics (hat tip), this article is for those who would like to learn about Return On Equity (ROE) and why it is important. We'll use ROE to examine C3is Inc. (NASDAQ:CISS), by way of a worked example.
Return on equity or ROE is a key measure used to assess how efficiently a company's management is utilizing the company's capital. In short, ROE shows the profit each dollar generates with respect to its shareholder investments.
See our latest analysis for C3is
How To Calculate Return On Equity?
The formula for ROE is:
Return on Equity = Net Profit (from continuing operations) ÷ Shareholders' Equity
So, based on the above formula, the ROE for C3is is:
17% = US$9.3m ÷ US$56m (Based on the trailing twelve months to December 2023).
The 'return' is the income the business earned over the last year. One way to conceptualize this is that for each $1 of shareholders' capital it has, the company made $0.17 in profit.
Does C3is Have A Good Return On Equity?
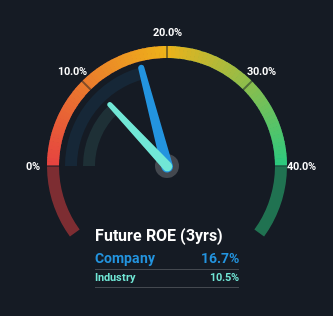
One simple way to determine if a company has a good return on equity is to compare it to the average for its industry. The limitation of this approach is that some companies are quite different from others, even within the same industry classification. As is clear from the image below, C3is has a better ROE than the average (10%) in the Shipping industry.
That is a good sign. However, bear in mind that a high ROE doesn’t necessarily indicate efficient profit generation. A higher proportion of debt in a company's capital structure may also result in a high ROE, where the high debt levels could be a huge risk . To know the 3 risks we have identified for C3is visit our risks dashboard for free.
The Importance Of Debt To Return On Equity
Companies usually need to invest money to grow their profits. That cash can come from retained earnings, issuing new shares (equity), or debt. In the case of the first and second options, the ROE will reflect this use of cash, for growth. In the latter case, the use of debt will improve the returns, but will not change the equity. That will make the ROE look better than if no debt was used.
C3is' Debt And Its 17% ROE
C3is is free of net debt, which is a positive for shareholders. Its respectable ROE suggests it is a business worth watching, but it's even better the company achieved this without leverage. After all, with cash on the balance sheet, a company has a lot more optionality in good times and bad.
Summary
Return on equity is a useful indicator of the ability of a business to generate profits and return them to shareholders. A company that can achieve a high return on equity without debt could be considered a high quality business. If two companies have around the same level of debt to equity, and one has a higher ROE, I'd generally prefer the one with higher ROE.
But ROE is just one piece of a bigger puzzle, since high quality businesses often trade on high multiples of earnings. Profit growth rates, versus the expectations reflected in the price of the stock, are a particularly important to consider. Check the past profit growth by C3is by looking at this visualization of past earnings, revenue and cash flow.
Of course, you might find a fantastic investment by looking elsewhere. So take a peek at this free list of interesting companies.
Have feedback on this article? Concerned about the content? Get in touch with us directly. Alternatively, email editorial-team (at) simplywallst.com.
This article by Simply Wall St is general in nature. We provide commentary based on historical data and analyst forecasts only using an unbiased methodology and our articles are not intended to be financial advice. It does not constitute a recommendation to buy or sell any stock, and does not take account of your objectives, or your financial situation. We aim to bring you long-term focused analysis driven by fundamental data. Note that our analysis may not factor in the latest price-sensitive company announcements or qualitative material. Simply Wall St has no position in any stocks mentioned.
