
 Yahoo Finance
 Should You Buy SoFi Technologies (SOFI) Ahead of Q1 Earnings?

SoFi Technologies, Inc. SOFI will report its first-quarter 2024 results on Apr 29, before the bell.
Let’s check out how SOFI is currently doing.
Stock Performance & Valuation
The stock gained 30% over the past year. Although an impressive gain, outperforming the Zacks S&P 500 composite’s rally of 21.8%, the stock has underperformed the 47.3% rally of the industry.
On the basis of EV-to-EBITDA, SOFI is currently trading at 13.55X compared with the industry’s 57.18X. If we look at the Price/Earnings ratio, SOFI shares currently trade at 55.98X forward earnings, well above the industry’s 38.01X.
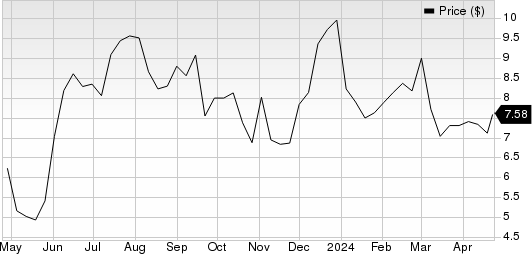
SoFi Technologies, Inc. Price
SoFi Technologies, Inc. price | SoFi Technologies, Inc. Quote
Sales and Margin Performance
The company had an exceptional year in 2023. It saw a remarkable 35% increase in adjusted net revenue, reaching a record high of $2.1 billion. This indicates a strong demand for services. Adjusted EBITDA soared by 200% year over year, reaching $432 million. This significant increase demonstrates improved operational efficiency. SOFI achieved a remarkable 54% incremental margin and a consolidated EBITDA margin of 21% for 2023. These margins exceed the company’s long-term target of 30%, indicating efficient cost management.
Members and Products
Members and products both experienced robust growth rates of more than 40% in 2023. The company added 2.3 million new members in 2023, bringing the total to 7.5 million members. Additionally, 3.2 million new products were added, resulting in a total of 11 million products by the end of the year.
Liquidity
SOFI’s current ratio (a measure of liquidity) was at 1.04 at the end of fourth-quarter 2023, lower than the prior quarter’s 1.52 and the year ago quarter’s 2. A current ratio of more than 1 often indicates that a company will be easily paying off its short-term obligations. However, a decreasing current ratio does not bode well.
Sales and EPS Growth Prospects
The Zacks Consensus Estimate for SOFI’s 2024 sales and EPS implies year-over-year growth of 15.5% and 122.2%, respectively. The estimate for EPS has moved north by a penny over the past 30 days.
To Conclude
While SOFI trades at a discount relative to its industry based on EV-to-EBITDA, it looks expensive based on P/E. The company’s liquidity position based on the current ratio remains healthy, but the decreasing trend poses a bit of concern.
Since the stock has risen a whopping 30% in the past year, it may undergo a correction soon, especially when SOFI does not seem poised for an earnings beat. Our quantitative model suggests that the combination of two key elements — a positive Earnings ESP and a Zacks Rank #3 (Hold) or better — increases the odds of a positive earnings surprise. But that’s not the case with SOFI at present, as it has an Earnings ESP of -45.71% and carries a Zacks Rank #3.
Given this backdrop, it may not be a bad idea to wait for this fundamentally strong stock to undergo some correction and offer a better entry point rather than rushing to purchase the stock before Apr 29. This tactic will help you “Buy the Dip.”
Stocks That Warrant a Look
Here are a few stocks from the broader Business Services sector, which, according to our model, also have the right combination of elements to beat on earnings this season.
AppLovin APP: The Zacks Consensus Estimate for the company’s first-quarter 2024 revenues is pegged at $969.9 million, indicating a rise of 35.6% from the year-ago quarter’s reported figure. For earnings, the consensus mark is pegged at 57 cents per share, suggesting a rise of more than 100% from the year-ago quarter’s actual. The company beat the consensus estimate in three of the past four quarters and missed once, with an average surprise of 26.5%.
APP has an Earnings ESP of +2.66% and currently sports a Zacks Rank of 3. The company is scheduled to post its first-quarter results on May 8. You can see the complete list of today’s Zacks #1 Rank stocks here.
Charles River Associates CRAI: The Zacks Consensus Estimate for the company’s first-quarter 2024 revenues is pegged at $160.7 million, indicating 5.1% growth from the year-ago quarter’s reported figure. For earnings, the consensus mark is pegged at $1.4 per share, suggesting a 7.8% rise from the year-ago quarter’s actual. The company beat the consensus estimate in two of the past four quarters and missed on the other two, with an average surprise of 8.1%.
CRAI currently has an Earnings ESP of +0.54% and a Zacks Rank of 1. The company is scheduled to declare its first-quarter results on May 2.
Stay on top of upcoming earnings announcements with the Zacks Earnings Calendar.
Want the latest recommendations from Zacks Investment Research? Today, you can download 7 Best Stocks for the Next 30 Days. Click to get this free report
Charles River Associates (CRAI) : Free Stock Analysis Report
AppLovin Corporation (APP) : Free Stock Analysis Report
SoFi Technologies, Inc. (SOFI) : Free Stock Analysis Report
