
 Yahoo Finance
 Should You Buy Lian Beng Group Ltd (SGX:L03) For Its Dividend?

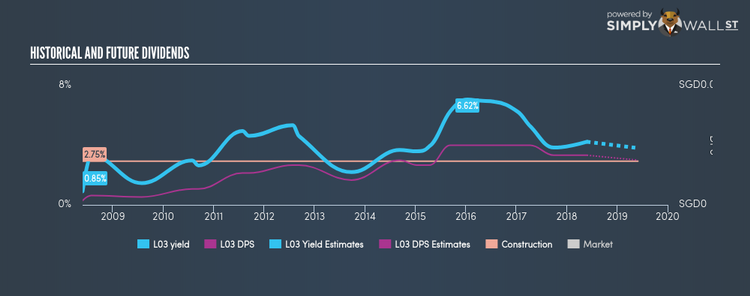
Dividends play a key role in compounding returns over time and can form a large part of our portfolio return. Over the past 10 years, Lian Beng Group Ltd (SGX:L03) has returned an average of 4.00% per year to shareholders in terms of dividend yield. Let’s dig deeper into whether Lian Beng Group should have a place in your portfolio. Check out our latest analysis for Lian Beng Group
5 questions to ask before buying a dividend stock
When researching a dividend stock, I always follow the following screening criteria:
Is its annual yield among the top 25% of dividend-paying companies?
Has it paid dividend every year without dramatically reducing payout in the past?
Has it increased its dividend per share amount over the past?
Is its earnings sufficient to payout dividend at the current rate?
Based on future earnings growth, will it be able to continue to payout dividend at the current rate?
How well does Lian Beng Group fit our criteria?
The company currently pays out 23.01% of its earnings as a dividend, according to its trailing twelve-month data, meaning the dividend is sufficiently covered by earnings. Furthermore, analysts have not forecasted a dividends per share for the future, which makes it hard to determine the yield shareholders should expect, and whether the current payout is sustainable, moving forward. If there is one thing that you want to be reliable in your life, it’s dividend stocks and their constant income stream. Although L03’s per share payments have increased in the past 10 years, it has not been a completely smooth ride. Shareholders would have seen a few years of reduced payments in this time. Compared to its peers, Lian Beng Group has a yield of 3.97%, which is high for Construction stocks but still below the market’s top dividend payers.
Next Steps:
If you are building an income portfolio, then Lian Beng Group is a complicated choice since it has some positive aspects as well as negative ones. However, if you are not strictly just a dividend investor, the stock could still offer some interesting investment opportunities. Given that this is purely a dividend analysis, I recommend taking sufficient time to understand its core business and determine whether the company and its investment properties suit your overall goals. There are three essential factors you should further research:
Future Outlook: What are well-informed industry analysts predicting for L03’s future growth? Take a look at our free research report of analyst consensus for L03’s outlook.
Historical Performance: What has L03’s returns been like over the past? Go into more detail in the past track record analysis and take a look at the free visual representations of our analysis for more clarity.
Dividend Rockstars: Are there better dividend payers with stronger fundamentals out there? Check out our free list of these great stocks here.
To help readers see pass the short term volatility of the financial market, we aim to bring you a long-term focused research analysis purely driven by fundamental data. Note that our analysis does not factor in the latest price sensitive company announcements.
The author is an independent contributor and at the time of publication had no position in the stocks mentioned.
