
 Yahoo Finance
 Brent Crude Oil Price Update – Trader Reaction to $59.71 Will Set the Tone Today
International-benchmark Brent crude oil futures are edging lower early Wednesday after the American Petroleum Institute’s (API) weekly storage report showed an unexpected build. Profit-taking after yesterday strong rally is also pressuring prices.
On Tuesday, prices jumped over 4 percent after Washington said it would delay tariffs on some Chinese goods. However, optimism wore off earlier in today’s session after China reported weaker than expected economic news.
At 05:33 GMT, December Brent crude oil is trading $59.82, down $0.66 or -1.09%.
Daily Swing Chart Technical Analysis
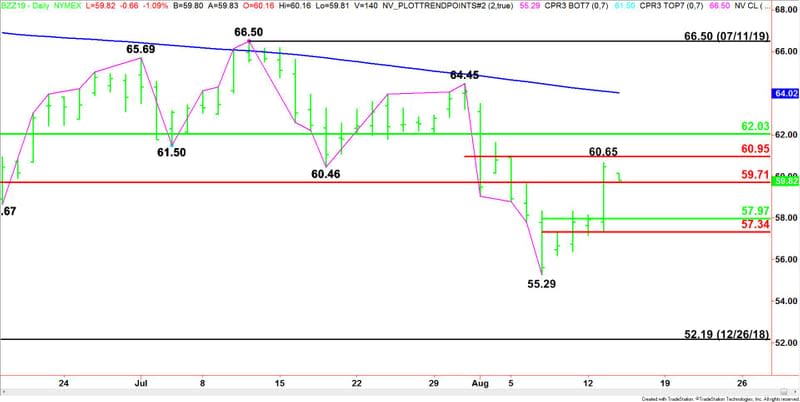
The main trend is down according to the daily swing chart. Despite an upward bias the last four sessions, momentum is still to the downside since no significant resistance areas have been taken out.
The main trend will change to up on a trade through $64.45. A move through $55.29 will signal a resumption of the downtrend.
The December 26, 2018 main bottom is $52.19 and the April 25, 2019 main top is $71.87. The retracement zone of this range is $62.03 to $59.71. This zone is controlling the near-term direction of the market. This zone is currently being tested.
The short-term range is $64.45 to $55.29. Its retracement zone at $59.87 to $60.95 is inside the main retracement zone. This zone stopped the rally on Tuesday at $60.65.
The minor range is $55.29 to $60.65. Its retracement zone at $57.97 to $57.34 is a potential downside target.
Daily Swing Chart Technical Forecast
Based on yesterday’s price action and the current price at $59.82, the direction of the December Brent crude oil futures contract on Wednesday is likely to be determined by trader reaction to the main Fibonacci level at $59.71.
Bullish Scenario
A sustained move over $59.71 will indicate the presence of buyers. If this creates enough upside momentum then look for a potential move into a series of levels including the short-term 50% level at $59.87, yesterday’s high at $60.65 and the short-term Fibonacci level at $60.95. Overtaking the Fib level could trigger a surge into the main 50% level at $62.03. This is the trigger point for a potential acceleration to the upside.
Bearish Scenario
A sustained move under $59.71 will signal the presence of sellers. This is a potential trigger point for an acceleration into the short-term retracement zone at $57.97 to $57.34.
Overview
Today’s U.S. Energy Information Administration’s weekly inventory report will come out at 14:30 GMT. Traders are looking for a draw of 2.5 million barrels. Prices could break hard if the report shows a build.
This article was originally posted on FX Empire
