
 Yahoo Finance
 Bitcoin Sinks Below $10k on $133 Billion January Loss
Bitcoin price has dropped to the lowest level since for two weeks and could drop below $9,000 in the next 24 hours, price charts indicate.
The downward move follows a month for bitcoin when its market capitalization has tumbled from a high of $296 billion on Jan. 5 to $163 billion today – a $133 billion (44.93 percent) loss.
Having failed to hold above the $10,000 mark for the third time in last 48 hours, prices on CoinDesk's Bitcoin Price Index (BPI) dropped to $9,480. The BPI was last seen this low on Jan. 17, when prices fell to $9,199.59.
On a 24-hour basis, bitcoin (BTC) is down 6.16 percent, according to data source CoinMarketCap. Further, the price action in the last 48 hours has established the former support zone of $10,000–$10,313 (50 percent Fibonacci retracement of 2017 low–high) as a strong resistance.
15-minute chart

The above chart shows bitcoin repeatedly ran into offers in the range of $10,000–$10,313 over the last two days. The drop from the high of $10,166 seen today has yielded a downside break of the 700-point trading range defined by $9,600 (Jan. 31 low) and $10,300 (Jan. 31 high).
So, the doors are open for a drop to $8,900 (target as per the measured height method; range value subtracted from range floor).
Bitcoin chart (log scale)
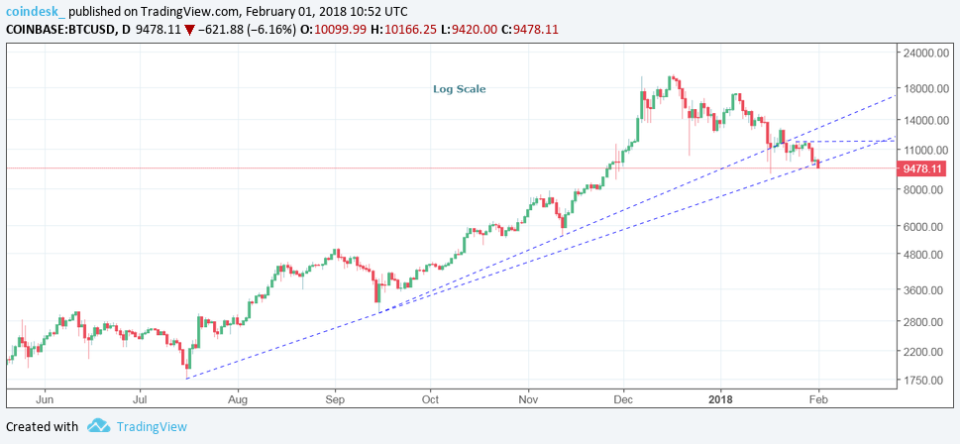
BTC has also breached the ascending trendline support (now resistance) of $9,880, adding credence to the bearish set up on the 15-minute chart.
The same trendline support is seen around $5,700 on a linear (arithmetic chart below). However, linear charts tend to be a bit distorted with fast-moving assets like bitcoin.
Meanwhile, the logarithmic chart is plotted in such a way that two equal percent changes are plotted as the same vertical distance on the scale. Therefore, distortions created by one or two big price moves (on linear chart) are smoothed out.
Also, as seen in the above chart, BTC tends to respect trendlines drawn on logarithmic charts.
Still, it is worth noting that as per the linear chart below, the trendline drawn from the Sep. 15 low and Nov. 12 low could offer support around 9,048 today.
Bitcoin chart (linear scale)

View
BTC looks set to test $8,900 in the next 24 hours.
A corrective rally due to intraday oversold conditions cannot be ruled out, but may be short-lived as the 5-day moving average (MA) and 10-day MA are trending down.
Price action in the last 48 hours has established $10,000–$10,313 as a strong resistance zone. So, only a daily close (as per UTC) above $10,313 would signal bearish invalidation. Meanwhile, a move above $11,690 (Jan. 25 high) would signal a short-term bearish-to-bullish trend change.
Arrows image via Shutterstock
