
 Yahoo Finance
 Bitcoin and ETH Price Prediction: Risk of Downside Break, UNI Could Surge To $8
Key Insights:
Bitcoin is slowly moving lower towards the $20,000 support.
Ether (ETH) declined below the key $1,160 support.
UNI broke a crucial barrier and might surge towards $8.00.
Bitcoin
After a few failed attempts near $22,000, bitcoin price reacted to the downside. The price gained pace after it broke the $21,185 support zone.
The price settled below the $21,000 level and the 21 simple moving average (H1). The current price action is bearish below the $20,550 level. On the downside, there is a major support at $20,000. A daily close below $20,000 could start a major decline.
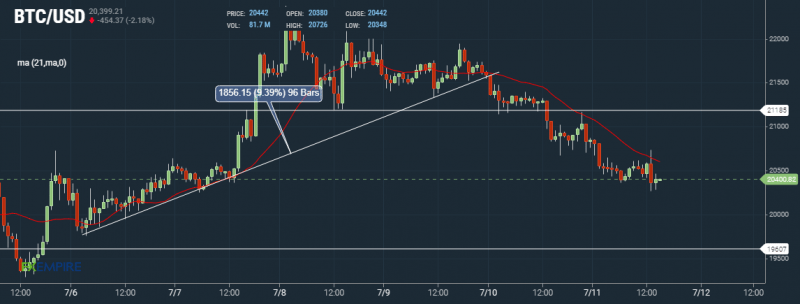
On the upside, the price could face resistance near the $20,650 level. The main resistance is now forming near the $21,185 level.
Ethereum (ETH)
ETH also started a bearish wave from the $1,275 zone. There was a steady decline below the $1,200 level and the price moved into a negative zone.
Ether even declined below the $1,160 support and settled below the 21 simple moving average (H1). It is now consolidating above the $1,120 support zone. On the upside, there are many hurdles forming near $1,160 and $1,175.
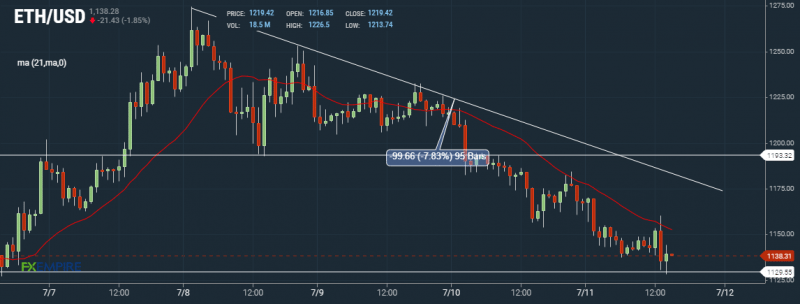
There is also a key bearish trend line with resistance near $1,175 on the hourly chart. A close above the $1,175 level could set the pace for a larger increase. On the downside, there is a key support near the $1,120 level, below which the price could restart decline and test $1,040.
Uniswap (UNI)
UNI formed a support base near the $3.35 level after a strong decline. The price remained well bid and started a steady recovery wave above the $4.0 level.
The price climbed above the $5.00 resistance and the 21-day simple moving average. There was a clear move above a crucial bearish trend line with resistance near $5.20 on the daily chart. It even broke the $5.80 resistance, which is now acting as a support.
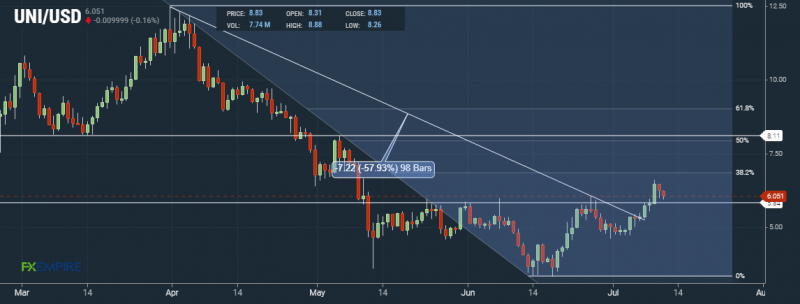
On the upside, UNI might face resistance near the $6.80 level. If there is a clear move, the price could rise towards the $8.00 barrier or the 50% Fib retracement level of the downward move from the $12.50 resistance zone to $3.35 low.
If there is no upside break, the price could restart decline and test the $5.00 level. The next major support sits near the $4.20 level.
ADA, BNB, and DOT price
Cardano (ADA) is slowly moving lower below the $0.45 support. If the bears remain in action, the price could test the $0.412 support.
BNB is consolidating near the $230 level. The first key resistance is near $235. A clear move above $235 might call for a test of the $250 resistance.
Polkadot (DOT) is back below the $7.0 pivot level. The next major support is near $6.55, below which it might slide to $6.32.
A few trending coins are MATIC, ATOM, and XMR. Out of these, XMR is gaining pace above the $125 resistance zone.
This article was originally posted on FX Empire
More From FXEMPIRE:
Oil steadies as China COVID fears face tight supply concerns
Non-white ICU patients get less oxygen treatment than needed -study
Biden to hold four-way virtual summit with Israel, UAE and India
Rescuers pull survivors from ruined Ukrainian apartment building
Biden pushes to ban assault weapons, gets heckled at gun violence event
