
 Yahoo Finance
 Bed Bath & Beyond (BBBY) Stock Down on Q3 Loss, Sales Miss
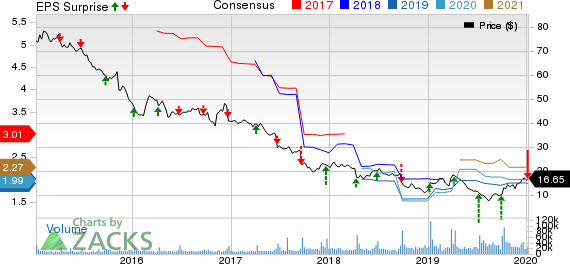
Bed Bath & Beyond Inc. BBBY reported dismal third-quarter fiscal 2019 results, wherein the company incurred loss per share. Moreover, the top line lagged the Zacks Consensus Estimate and declined on a year-over-year basis.
Results were mainly hurt by the calendar shift of the Thanksgiving holiday in 2019. Apart from this, the company’s business was challenged with certain self-inflicted issues such as noncompetitive pricing and dearth of convenient shopping choices. Management stated that sales and profitability are likely to be under pressure in fiscal fourth quarter.
Following the quarterly earnings release, shares of Bed Bath & Beyond lost approximately 10% during the after-market trading session on Jan 8.
Q3 in Detail
Bed Bath & Beyond reported adjusted loss of 38 cents per share in fiscal third quarter, against the Zacks Consensus Estimate of an earnings of 3 cents. Also, the reported figure compared unfavorably with adjusted earnings of 2 cents in the year-ago quarter.
Net sales fell nearly 9% to $2,759.3 million and lagged the Zacks Consensus Estimate of $2,859 million. The downside was caused by comparable sales (comps) decline of 8.3%. Comps fell due to lower store transactions, somewhat offset by a rise in the average transaction amount. In fact, comps in stores fell in high single-digit percentage range, while the metric at the company’s digital channel fell in mid-single digit percentage range.
Notably, quarterly sales were significantly hurt by calendar shift of the Thanksgiving holiday, which fell short of one week compared with the year-ago period. Adjusting for this shift, including Thanksgiving and Cyber Monday weeks, comps fell 3.6% in the reported quarter. The decline of 3.6% resulted from a fall of 6.5% in store sales, somewhat offset by a rise of 9.4% in digital sales.
Nevertheless, comps on a shifted basis increased 7.1% during the five-day shopping period from Thanksgiving to Cyber Monday.
Further, gross profit declined nearly 9% to $913.8 million in the reported quarter. Also, adjusted gross margin contracted 80 basis points (bps) to 32.3%, mainly driven by lower merchandise margins on increased promotional activity and partly offset by a decline in net direct to customer shipping expense.
Adjusted SG&A expenses dropped 2.3% to $931.8 million, driven by gains from its cost structure and optimization efforts. As a percentage of net sales, SG&A increased 140 bps to 33.8% mainly owing to higher occupancy, advertising and technology-related costs. Further, the company incurred operating loss of $29.8 million against income of $49.5 million in the year-ago quarter.
Financial Position
Bed Bath & Beyond ended fiscal third quarter with cash and investments of roughly $920 million. Long-term debt totaled $1,488.3 million and total shareholders' equity came in at $1,848.2 million as of Nov 30, 2019.
At the end of first nine months of fiscal 2019, the company generated cash flow of about $257.1 million from operating activities and deployed nearly $188.4 million toward capital expenditures.
For fiscal 2019, capital expenditures are anticipated between $275 million and $300 million compared with $350-$375 million expected earlier.
Share Buyback & Dividend
In the reported quarter, Bed Bath & Beyond repurchased stock worth nearly $1.2 million, reflecting about 87,000 shares.
Additionally, the company’s board declared a quarterly dividend of 17 cents per share, payable Apr 14, 2020, to its shareholders of record as on Mar 13.
Store Update
In third-quarter fiscal 2019, Bed Bath & Beyond inaugurated four stores — one namesake, two Cost Plus World Market and one One Kings Lane stores. Simultaneously, it closed 14 outlets, including 13 namesake and one Cost Plus World Market stores.
As of Nov 30, 2019, the company had 1,524 stores in operation, comprising 981 namesake stores across 50 states, the District of Columbia, Puerto Rico and Canada; 278 stores under the labels World Market, Cost Plus World Market or Cost Plus; 126 buybuy BABY stores; 81 stores under the labels Christmas Tree Shops, Christmas Tree Shops andThat! or andThat!; 55 stores under Harmon, Harmon Face Values or Face Values names; and three stores under the label One Kings Lane.
Additionally, the Zacks Rank #3 (Hold) company’s joint venture operates 10 flagship stores in Mexico.
During the current fiscal year, the company is on track to open nearly 10 total stores, including two flagship outlets.
Stocks to Watch
DICK'S Sporting Goods, Inc DKS outpaced earnings estimates in three of the trailing four quarters, the average being 11.5%. The company currently sports a Zacks Rank #1 (Strong Buy). You can see the complete list of today’s Zacks #1 Rank stocks here.
Hibbett Sports, Inc HIBB, also a Zacks Rank #1 stock, has an expected long-term earnings growth rate of 12.2%.
Five Below, Inc FIVE has an impressive long-term earnings growth rate of 24.3%. The company currently has a Zacks Rank of 2 (Buy).
Today's Best Stocks from Zacks
Would you like to see the updated picks from our best market-beating strategies? From 2017 through Q3 2019, while the S&P 500 gained +39.6%, five of our strategies returned +51.8%, +57.5%, +96.9%, +119.0%, and even +158.9%.
This outperformance has not just been a recent phenomenon. From 2000 – Q3 2019, while the S&P averaged +5.6% per year, our top strategies averaged up to +54.1% per year.
See their latest picks free >>
Click to get this free report Bed Bath & Beyond Inc. (BBBY) : Free Stock Analysis Report Hibbett Sports, Inc. (HIBB) : Free Stock Analysis Report Five Below, Inc. (FIVE) : Free Stock Analysis Report DICK'S Sporting Goods, Inc. (DKS) : Free Stock Analysis Report To read this article on Zacks.com click here. Zacks Investment Research
