
 Yahoo Finance
 Beazer Homes USA's (NYSE:BZH) Returns On Capital Are Heading Higher
There are a few key trends to look for if we want to identify the next multi-bagger. Firstly, we'll want to see a proven return on capital employed (ROCE) that is increasing, and secondly, an expanding base of capital employed. This shows us that it's a compounding machine, able to continually reinvest its earnings back into the business and generate higher returns. So when we looked at Beazer Homes USA (NYSE:BZH) and its trend of ROCE, we really liked what we saw.
Understanding Return On Capital Employed (ROCE)
For those that aren't sure what ROCE is, it measures the amount of pre-tax profits a company can generate from the capital employed in its business. Analysts use this formula to calculate it for Beazer Homes USA:
Return on Capital Employed = Earnings Before Interest and Tax (EBIT) ÷ (Total Assets - Current Liabilities)
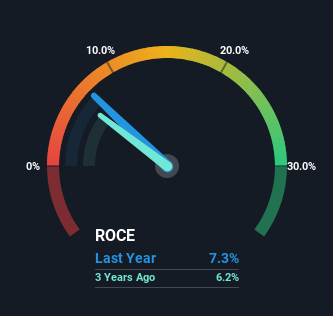
0.073 = US$167m ÷ (US$2.5b - US$240m) (Based on the trailing twelve months to March 2024).
Thus, Beazer Homes USA has an ROCE of 7.3%. Ultimately, that's a low return and it under-performs the Consumer Durables industry average of 15%.
View our latest analysis for Beazer Homes USA
Above you can see how the current ROCE for Beazer Homes USA compares to its prior returns on capital, but there's only so much you can tell from the past. If you'd like, you can check out the forecasts from the analysts covering Beazer Homes USA for free.
What Does the ROCE Trend For Beazer Homes USA Tell Us?
Even though ROCE is still low in absolute terms, it's good to see it's heading in the right direction. The data shows that returns on capital have increased substantially over the last five years to 7.3%. The amount of capital employed has increased too, by 21%. The increasing returns on a growing amount of capital is common amongst multi-baggers and that's why we're impressed.
The Key Takeaway
All in all, it's terrific to see that Beazer Homes USA is reaping the rewards from prior investments and is growing its capital base. Since the stock has returned a staggering 189% to shareholders over the last five years, it looks like investors are recognizing these changes. In light of that, we think it's worth looking further into this stock because if Beazer Homes USA can keep these trends up, it could have a bright future ahead.
Beazer Homes USA does have some risks though, and we've spotted 1 warning sign for Beazer Homes USA that you might be interested in.
If you want to search for solid companies with great earnings, check out this free list of companies with good balance sheets and impressive returns on equity.
Have feedback on this article? Concerned about the content? Get in touch with us directly. Alternatively, email editorial-team (at) simplywallst.com.
This article by Simply Wall St is general in nature. We provide commentary based on historical data and analyst forecasts only using an unbiased methodology and our articles are not intended to be financial advice. It does not constitute a recommendation to buy or sell any stock, and does not take account of your objectives, or your financial situation. We aim to bring you long-term focused analysis driven by fundamental data. Note that our analysis may not factor in the latest price-sensitive company announcements or qualitative material. Simply Wall St has no position in any stocks mentioned.
