
 Yahoo Finance
 Is Ban Leong Technologies Limited’s (SGX:B26) Balance Sheet A Threat To Its Future?

While small-cap stocks, such as Ban Leong Technologies Limited (SGX:B26) with its market cap of S$27.65m, are popular for their explosive growth, investors should also be aware of their balance sheet to judge whether the company can survive a downturn. Electronic companies, even ones that are profitable, are more likely to be higher risk. So, understanding the company’s financial health becomes vital. Here are few basic financial health checks you should consider before taking the plunge. Nevertheless, since I only look at basic financial figures, I’d encourage you to dig deeper yourself into B26 here.
How does B26’s operating cash flow stack up against its debt?
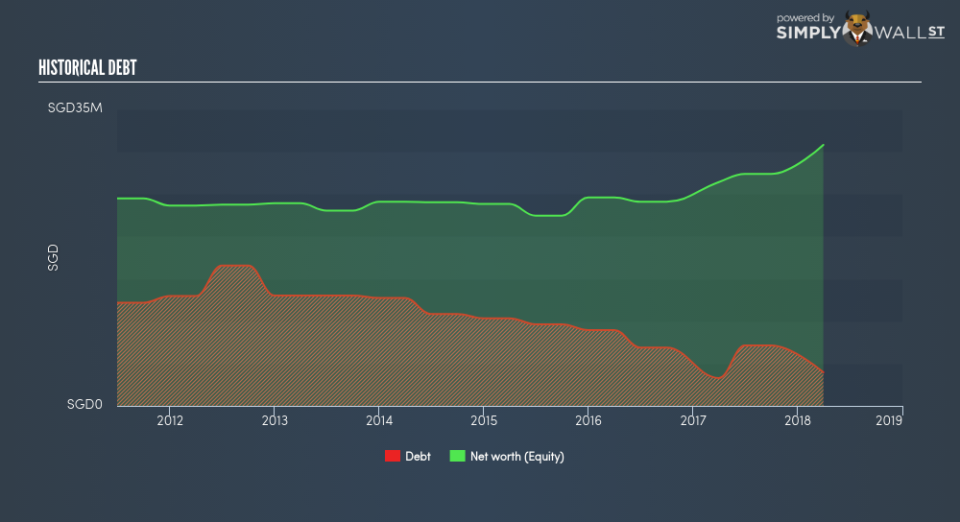
B26 has built up its total debt levels in the last twelve months, from S$3.29m to S$0 . With this rise in debt, B26 currently has S$14.77m remaining in cash and short-term investments , ready to deploy into the business. Moreover, B26 has generated cash from operations of S$4.72m in the last twelve months, resulting in an operating cash to total debt ratio of 119.21%, signalling that B26’s operating cash is sufficient to cover its debt. This ratio can also be interpreted as a measure of efficiency as an alternative to return on assets. In B26’s case, it is able to generate 1.19x cash from its debt capital.
Can B26 pay its short-term liabilities?
Looking at B26’s most recent S$32.36m liabilities, it seems that the business has been able to meet these obligations given the level of current assets of S$60.33m, with a current ratio of 1.86x. For Electronic companies, this ratio is within a sensible range since there is a bit of a cash buffer without leaving too much capital in a low-return environment.
Can B26 service its debt comfortably?
With a debt-to-equity ratio of 12.86%, B26’s debt level may be seen as prudent. This range is considered safe as B26 is not taking on too much debt obligation, which may be constraining for future growth.
Next Steps:
B26’s high cash coverage and low debt levels indicate its ability to utilise its borrowings efficiently in order to generate ample cash flow. Furthermore, the company exhibits an ability to meet its near term obligations should an adverse event occur. I admit this is a fairly basic analysis for B26’s financial health. Other important fundamentals need to be considered alongside. You should continue to research Ban Leong Technologies to get a better picture of the stock by looking at:
Future Outlook: What are well-informed industry analysts predicting for B26’s future growth? Take a look at our free research report of analyst consensus for B26’s outlook.
Valuation: What is B26 worth today? Is the stock undervalued, even when its growth outlook is factored into its intrinsic value? The intrinsic value infographic in our free research report helps visualize whether B26 is currently mispriced by the market.
Other High-Performing Stocks: Are there other stocks that provide better prospects with proven track records? Explore our free list of these great stocks here.
To help readers see pass the short term volatility of the financial market, we aim to bring you a long-term focused research analysis purely driven by fundamental data. Note that our analysis does not factor in the latest price sensitive company announcements.
The author is an independent contributor and at the time of publication had no position in the stocks mentioned.
