
 Yahoo Finance
 AVJennings (ASX:AVJ) May Have Issues Allocating Its Capital
If we want to find a stock that could multiply over the long term, what are the underlying trends we should look for? Amongst other things, we'll want to see two things; firstly, a growing return on capital employed (ROCE) and secondly, an expansion in the company's amount of capital employed. Basically this means that a company has profitable initiatives that it can continue to reinvest in, which is a trait of a compounding machine. In light of that, when we looked at AVJennings (ASX:AVJ) and its ROCE trend, we weren't exactly thrilled.
Return On Capital Employed (ROCE): What Is It?
If you haven't worked with ROCE before, it measures the 'return' (pre-tax profit) a company generates from capital employed in its business. To calculate this metric for AVJennings, this is the formula:
Return on Capital Employed = Earnings Before Interest and Tax (EBIT) ÷ (Total Assets - Current Liabilities)
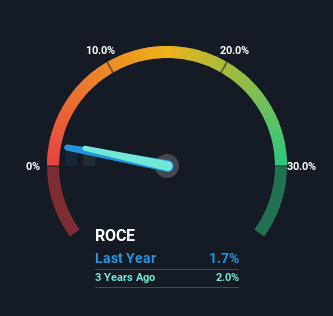
0.017 = AU$15m ÷ (AU$930m - AU$93m) (Based on the trailing twelve months to December 2023).
Thus, AVJennings has an ROCE of 1.7%. In absolute terms, that's a low return and it also under-performs the Consumer Durables industry average of 16%.
See our latest analysis for AVJennings
While the past is not representative of the future, it can be helpful to know how a company has performed historically, which is why we have this chart above. If you'd like to look at how AVJennings has performed in the past in other metrics, you can view this free graph of AVJennings' past earnings, revenue and cash flow.
What Does the ROCE Trend For AVJennings Tell Us?
Unfortunately, the trend isn't great with ROCE falling from 3.3% five years ago, while capital employed has grown 45%. Usually this isn't ideal, but given AVJennings conducted a capital raising before their most recent earnings announcement, that would've likely contributed, at least partially, to the increased capital employed figure. The funds raised likely haven't been put to work yet so it's worth watching what happens in the future with AVJennings' earnings and if they change as a result from the capital raise.
In Conclusion...
Bringing it all together, while we're somewhat encouraged by AVJennings' reinvestment in its own business, we're aware that returns are shrinking. And in the last five years, the stock has given away 20% so the market doesn't look too hopeful on these trends strengthening any time soon. On the whole, we aren't too inspired by the underlying trends and we think there may be better chances of finding a multi-bagger elsewhere.
Since virtually every company faces some risks, it's worth knowing what they are, and we've spotted 3 warning signs for AVJennings (of which 1 is concerning!) that you should know about.
While AVJennings isn't earning the highest return, check out this free list of companies that are earning high returns on equity with solid balance sheets.
Have feedback on this article? Concerned about the content? Get in touch with us directly. Alternatively, email editorial-team (at) simplywallst.com.
This article by Simply Wall St is general in nature. We provide commentary based on historical data and analyst forecasts only using an unbiased methodology and our articles are not intended to be financial advice. It does not constitute a recommendation to buy or sell any stock, and does not take account of your objectives, or your financial situation. We aim to bring you long-term focused analysis driven by fundamental data. Note that our analysis may not factor in the latest price-sensitive company announcements or qualitative material. Simply Wall St has no position in any stocks mentioned.