
 Yahoo Finance
 AutoZone (NYSE:AZO) Knows How To Allocate Capital
Did you know there are some financial metrics that can provide clues of a potential multi-bagger? Amongst other things, we'll want to see two things; firstly, a growing return on capital employed (ROCE) and secondly, an expansion in the company's amount of capital employed. This shows us that it's a compounding machine, able to continually reinvest its earnings back into the business and generate higher returns. Ergo, when we looked at the ROCE trends at AutoZone (NYSE:AZO), we liked what we saw.
What Is Return On Capital Employed (ROCE)?
For those that aren't sure what ROCE is, it measures the amount of pre-tax profits a company can generate from the capital employed in its business. To calculate this metric for AutoZone, this is the formula:
Return on Capital Employed = Earnings Before Interest and Tax (EBIT) ÷ (Total Assets - Current Liabilities)
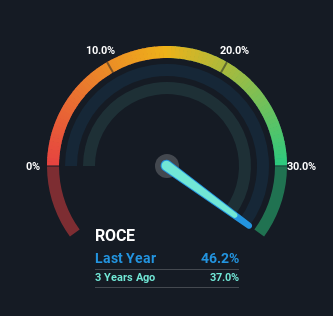
0.46 = US$3.7b ÷ (US$17b - US$8.8b) (Based on the trailing twelve months to February 2024).
Thus, AutoZone has an ROCE of 46%. In absolute terms that's a great return and it's even better than the Specialty Retail industry average of 13%.
Check out our latest analysis for AutoZone
In the above chart we have measured AutoZone's prior ROCE against its prior performance, but the future is arguably more important. If you'd like to see what analysts are forecasting going forward, you should check out our free analyst report for AutoZone .
What Does the ROCE Trend For AutoZone Tell Us?
We'd be pretty happy with returns on capital like AutoZone. The company has consistently earned 46% for the last five years, and the capital employed within the business has risen 80% in that time. Returns like this are the envy of most businesses and given it has repeatedly reinvested at these rates, that's even better. You'll see this when looking at well operated businesses or favorable business models.
On a separate but related note, it's important to know that AutoZone has a current liabilities to total assets ratio of 52%, which we'd consider pretty high. This effectively means that suppliers (or short-term creditors) are funding a large portion of the business, so just be aware that this can introduce some elements of risk. While it's not necessarily a bad thing, it can be beneficial if this ratio is lower.
What We Can Learn From AutoZone's ROCE
AutoZone has demonstrated its proficiency by generating high returns on increasing amounts of capital employed, which we're thrilled about. And long term investors would be thrilled with the 205% return they've received over the last five years. So even though the stock might be more "expensive" than it was before, we think the strong fundamentals warrant this stock for further research.
Since virtually every company faces some risks, it's worth knowing what they are, and we've spotted 2 warning signs for AutoZone (of which 1 shouldn't be ignored!) that you should know about.
AutoZone is not the only stock earning high returns. If you'd like to see more, check out our free list of companies earning high returns on equity with solid fundamentals.
Have feedback on this article? Concerned about the content? Get in touch with us directly. Alternatively, email editorial-team (at) simplywallst.com.
This article by Simply Wall St is general in nature. We provide commentary based on historical data and analyst forecasts only using an unbiased methodology and our articles are not intended to be financial advice. It does not constitute a recommendation to buy or sell any stock, and does not take account of your objectives, or your financial situation. We aim to bring you long-term focused analysis driven by fundamental data. Note that our analysis may not factor in the latest price-sensitive company announcements or qualitative material. Simply Wall St has no position in any stocks mentioned.
