
 Yahoo Finance
 Asia Enterprises Holding (SGX:A55) Shareholders Will Want The ROCE Trajectory To Continue
If you're looking for a multi-bagger, there's a few things to keep an eye out for. Typically, we'll want to notice a trend of growing return on capital employed (ROCE) and alongside that, an expanding base of capital employed. Ultimately, this demonstrates that it's a business that is reinvesting profits at increasing rates of return. Speaking of which, we noticed some great changes in Asia Enterprises Holding's (SGX:A55) returns on capital, so let's have a look.
What Is Return On Capital Employed (ROCE)?
For those that aren't sure what ROCE is, it measures the amount of pre-tax profits a company can generate from the capital employed in its business. To calculate this metric for Asia Enterprises Holding, this is the formula:
Return on Capital Employed = Earnings Before Interest and Tax (EBIT) ÷ (Total Assets - Current Liabilities)
0.06 = S$6.6m ÷ (S$115m - S$4.6m) (Based on the trailing twelve months to December 2023).
Thus, Asia Enterprises Holding has an ROCE of 6.0%. Ultimately, that's a low return and it under-performs the Trade Distributors industry average of 9.8%.
See our latest analysis for Asia Enterprises Holding
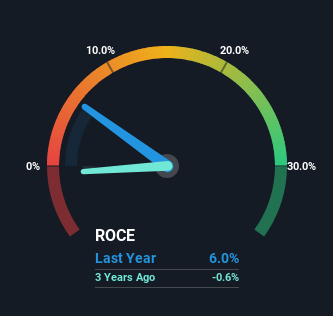
Historical performance is a great place to start when researching a stock so above you can see the gauge for Asia Enterprises Holding's ROCE against it's prior returns. If you're interested in investigating Asia Enterprises Holding's past further, check out this free graph covering Asia Enterprises Holding's past earnings, revenue and cash flow.
What Does the ROCE Trend For Asia Enterprises Holding Tell Us?
Asia Enterprises Holding has not disappointed with their ROCE growth. The figures show that over the last five years, ROCE has grown 1,414% whilst employing roughly the same amount of capital. So it's likely that the business is now reaping the full benefits of its past investments, since the capital employed hasn't changed considerably. The company is doing well in that sense, and it's worth investigating what the management team has planned for long term growth prospects.
The Bottom Line On Asia Enterprises Holding's ROCE
To sum it up, Asia Enterprises Holding is collecting higher returns from the same amount of capital, and that's impressive. Since the stock has only returned 12% to shareholders over the last five years, the promising fundamentals may not be recognized yet by investors. So with that in mind, we think the stock deserves further research.
One more thing to note, we've identified 2 warning signs with Asia Enterprises Holding and understanding these should be part of your investment process.
For those who like to invest in solid companies, check out this free list of companies with solid balance sheets and high returns on equity.
Have feedback on this article? Concerned about the content? Get in touch with us directly. Alternatively, email editorial-team (at) simplywallst.com.
This article by Simply Wall St is general in nature. We provide commentary based on historical data and analyst forecasts only using an unbiased methodology and our articles are not intended to be financial advice. It does not constitute a recommendation to buy or sell any stock, and does not take account of your objectives, or your financial situation. We aim to bring you long-term focused analysis driven by fundamental data. Note that our analysis may not factor in the latest price-sensitive company announcements or qualitative material. Simply Wall St has no position in any stocks mentioned.
