
 Yahoo Finance
 Apple (AAPL) Q2 Earnings Beat Estimates, Shares Up on Solid View
Apple AAPL reported second-quarter fiscal 2024 earnings of $1.53 per share, which beat the Zacks Consensus Estimate by 1.32% and inched up 0.7% year over year. Earnings benefited from strong expansion in services gross margin.
Net sales decreased 4.3% year over year to $90.75 billion but beat the Zacks Consensus Estimate by 0.85%. Unfavorable forex hurt net sales by 140 basis points (bps).
Shares were up 7.51% in pre-market trading following Apple CEO Tim Cook’s positive comments on plans to expand the usage of AI in the company’s devices and record $110 billion share repurchase announcement.
Shares of the iPhone maker have declined 10.1% year to date, underperforming the Zacks Computer & Technology sector’s return of 8.5%.
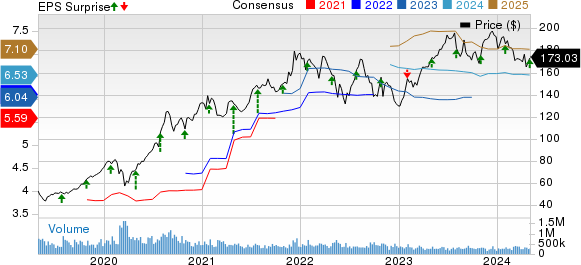
Apple Inc. Price, Consensus and EPS Surprise
Apple Inc. price-consensus-eps-surprise-chart | Apple Inc. Quote
iPhone Sales Declines Offset By Services Growth
iPhone sales decreased 10.5% from the year-ago quarter to $46 billion and accounted for 50.6% of total sales.
iPhone faced stiff year-over-year comparisons in the reported quarter. Apple stated that it had generated one-time revenues of nearly $5 billion in the year-ago quarter from strong demand for iPhone 14 Pro and 14 Pro Max. Excluding this, iPhone revenues would have increased year-over-year in the fiscal second quarter.
Overall, product sales (73.7% of sales) fell 9.5% year over year to $66.89 billion.
Services revenues grew 14.2% from the year-ago quarter to $23.87 billion and accounted for 26.3% of sales. The figure lagged the consensus mark by 1.2%.
Apple now has more than 1 billion paid subscribers across its Services portfolio, more than double what it had four years ago. Paid subscriptions grew double-digits year over year in the reported quarter.
Geographic Details
America’s sales decreased 1.4% year over year to $37.27 billion and accounted for 41.1% of total sales.
Europe generated $24.12 billion in sales, up 0.7% on a year-over-year basis. The region accounted for 26.6% of total sales.
Greater China sales decreased 8.1% from the year-ago quarter to $16.37 billion, accounting for 18% of total sales.
Rest of the Asia Pacific generated sales of $6.72 billion, down 17.2% year over year. The region accounted for 7.4% of total sales.
Japan’s sales of $6.26 billion decreased 12.7% year over year, accounting for 6.9% of total sales.
Mac Sales Up, iPad & Wearables Decline
Non-iPhone revenues (iPad, Mac and Wearables) decreased 7.4% year over year on a combined basis.
Mac sales of $7.45 billion increased 3.9% from the year-ago quarter and accounted for 8.2% of total sales.
Mac sales were driven by strong demand for MacBook Air and expanding enterprise adoption.
Apple’s latest Vision Pro has garnered significant enterprise attention, with the likes of KLM Airlines, Porsche and Lowe’s investing in the device.
iPad sales of $5.56 billion declined 16.7% year over year and accounted for 6.1% of total sales.
Wearables, Home and Accessories sales decreased 9.6% year over year to $7.91 billion and accounted for 8.7% of total sales.
Operating Details
Gross margin of 46.6% expanded 230 bps on a year-over-year basis. The gross margin expanded 70 bps sequentially due to a favorable mix and cost savings.
Products’ gross margin contracted 280 bps sequentially to 36.6%. Services’ gross margin was 74.6%, up 180 bps sequentially.
Operating expenses rose 5.2% year over year to $14.37 billion due to higher research & development expenses, which increased 6% year over year. Selling, general & administrative expenses increased 4.3% year over year.
As a percentage of revenues, research & development expenses, as well as selling, general & administrative expenses, increased 80 bps and 60 bps, respectively.
Operating margin expanded 90 bps on a year-over-year basis to 30.7%.
Balance Sheet
As of Mar 30, 2024, cash & marketable securities were $162.34 billion compared with $172.58 billion as of Dec 30, 2023.
Term debt, as of Mar 30, 2024, was $102.59 billion, down from $106.04 billion as of Dec 30, 2023.
Apple returned nearly $27 billion in the reported quarter through dividend payouts ($3.7 billion) and share repurchases ($23.5 billion). Its board also authorized an additional $110 billion for share repurchases.
Apple also raised dividend payout by 4% to 25 cents per share.
Guidance
Apple expects the June quarter’s (third-quarter fiscal 2024) revenues to grow low-single-digit year over year. Unfavorable forex is expected to hurt revenues by 2.5%.
Apple expects iPad revenues to grow double-digit in this current quarter.
For the Services segment, Apple expects a double-digit growth rate similar to the first half of fiscal 2024.
Gross margin is expected to be 45.5-46.5% in the third quarter of fiscal 2024. Operating expenses are expected to be between $14.3 billion and $14.5 billion.
Zacks Rank & Stocks to Consider
Apple currently carries a Zacks Rank #3 (Hold).
Some better-ranked stocks from the broader Computer and Technology sector are Arista Networks ANET, NVIDIA NVDA and Dell Technologies DELL, each carrying a Zacks Rank #2 (Buy) at present. You can see the complete list of today’s Zacks #1 Rank (Strong Buy) stocks here.
Shares of Arista Networks have gained 11.6% year to date. ANET is set to report first-quarter 2024 results on May 7.
Shares of NVIDIA have surged 74.5% year to date. NVDA is slated to report first-quarter 2024 results on May 22.
Shares of Dell Technologies have rallied 62.1% year to date. DELL is set to report first-quarter fiscal 2025 results on May 30.
Want the latest recommendations from Zacks Investment Research? Today, you can download 7 Best Stocks for the Next 30 Days. Click to get this free report
Apple Inc. (AAPL) : Free Stock Analysis Report
Dell Technologies Inc. (DELL) : Free Stock Analysis Report
NVIDIA Corporation (NVDA) : Free Stock Analysis Report
Arista Networks, Inc. (ANET) : Free Stock Analysis Report
