
 Yahoo Finance
 American Airlines: Fundamentally a Riskier Bet
As first-quarter earnings season for U.S.-based airlines approaches, this may be a good time to look more closely at the fundamentals of a few key players in the space. Today, I explore American Airlines Group Inc. (NASDAQ:AAL), one of the three legacy carriers in the country, each of which produce around $50 billion in revenue each year.
Below, I dissect some of the key metrics and explain why the stock may be about as risky a bet as one can make today in large-cap U.S. airlines.
Still looking for a pivot
Between American Airlines, Delta Air Lines (NYSE:DAL) and United Airlines (NASDAQ:UAL), the former stands out, among a few other things, as being the least profitable on a per-unit basis. Before diving into the numbers, it is important to explain some key operating metrics.
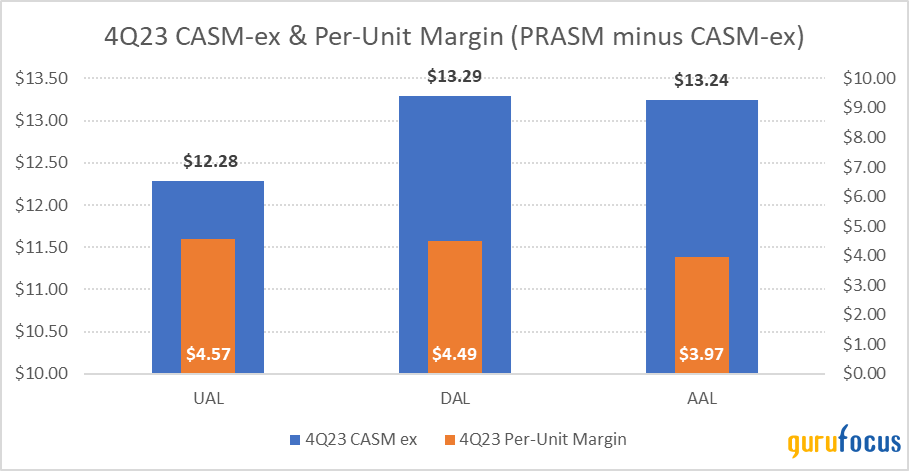
In the airline industry, passenger revenue per available seat mile (or PRASM) is how much the company receives from its passengers to fly one unit of capacity, defined here as one seat flown over one mile. Cost per available seat mile, excluding certain items like fuel and others, or CASM-ex, represents per-unit operating costs. The former minus the latter gives us a sense of operating profit per unit, again excluding crucial (but very volatile) expenses like jet fuel.
American Airlines produces quite a bit of revenue per unit of capacity at a PRASM of $17.21 in the fourth quarter of 2023 versus United's $16.85 and Southwest Airlines' (NYSE:LUV) mere $13.65 (worth noting, the latter is considered a budget or low-cost airline, unlike American or United). This is likely a function of American's leadership position in certain high-yielding domestic markets, possibly a favorable mix of premium-to-economy seats, and dominance in the (sometimes volatile) Latin American segment this region accounted for nearly half of American's international revenue in 2023.
However, American is also one of the worst at keeping operating costs under control. The chart below shows the company's CASM-ex in the fourth quarter nearly matched that of Delta, with the important difference that the Atlanta-based airline produced over 50 cents in additional PRASM. All accounted for, American Airlines currently has the lowest per-unit margin of $3.97, or 23% of PRASM, about as low as it gets in the U.S. airline space, aside from Southwest Airlines.
Source: DM Martins' Research, data from company reports.
American's low-margin profile is nothing new. In the quarter that preceded the start of the Covid-19 crisis, the Fort Worth, Texas-based company produced only $3.13 in per-unit profit, or 21% of PRASM, compared to United's $3.45 and Delta's industry-leading $4.44. Therefore, from a financial results perspective, American Airlines has struggled to stand out among its peer group, whether it be in a pre- or post-pandemic environment.
Likely for this reason, American keeps trying to reinvent itself operationally. The most recent effort was communicated at the company's Investor Day held last month. During the event, the management team expressed its renewed focus on regional markets to leverage the company's hub structure and its travel rewards program, which in theory can help the company monetize its highest-value customer base.
The plan could very well lead to a better airline that is more efficient at producing profits, possibly creating value for shareholders who place a bet on the stock today. However, it also underscores American Airlines' dire need to find a pivot so that it can finally be perceived as a best-in-class U.S. airline. The rewards for investors can be substantial, but so can the risks.
American Airlines is highly levered
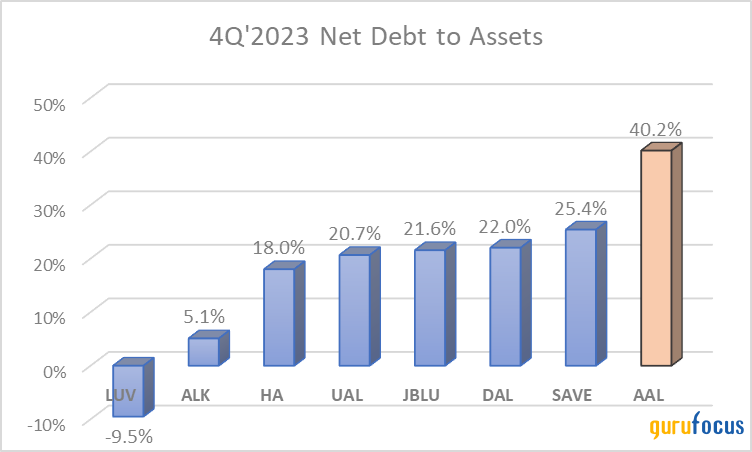
If inferior operating performance was not enough, American Airlines also has one of the most leveraged balance sheets in the industry. As of the fourth quarter, the company's net debt added up to around 40% of its total assets. This is, by far, the largest leverage factor among the major U.S. airlines, as the chart below depicts.
Source: DM Martins' Research, using data from company reports
Granted, American Airlines did a relatively good job keeping its debt under control in the past few years, considering how disruptive the pandemic has been to air travel. While Delta's net debt-to-asset ratio has nearly doubled since the fourth quarter of 2019, from 12% to 22%, American Airlines' increased more modestly from 34% to 40%.
Still, in addition to the less enticing margin profile described above, American Airlines' balance sheet provides yet another reason to be cautious about an investment in the stock. This is not to say the company is in deep trouble and its shares should be avoided altogether. Rather, it means a bet here likely comes attached with high-risk, high-reward potential.
The valuation is not as low as it seems
On a current-year basis, American Airlines' stock is valued at only 5.90 times earnings, seemingly a steal if compared to the S&P 500's current year price-earnings ratio of 27.90. Bargain hunters might be even more tempted to buy the stock considering the consensus expectation for 37% earnings per share growth in 2025.
The problem is that airlines, by default, tend to trade at a discount to the market due to the risky business model that is highly cyclical, sensitive to oil prices, asset-heavy and brutally competitive. A more meaningful analysis here would be a comparison to the peer group's valuation metrics. Unfortunately for prospective American Airlines investors, the stock's 5.90 times earnings multiple looks much less enticing against United Airlines' 4.40 times, especially considering the Chicago-based company's better per-unit margins and lower debt levels.
Therefore, I believe the less speculative, less risk-seeking investors may want to consider options other than American, should they choose to be exposed to the U.S. airline sector.
This article first appeared on GuruFocus.
