
 Yahoo Finance
 Alt Coins Price forecast for the week of February 5, 2018, Technical Analysis
Bitcoin Gold
The Bitcoin Gold market broke down significantly during the week, slicing down towards the $100 level before buyers return. However, volume is very low, so I think at this point a lot of retail traders have stepped away, and I think that it’s only a matter of time before rallies will be sold off as a lot of psychological damage will have been done to the average retail trader.
BTG/USD DASH USD and XMR USD Video 05.02.18

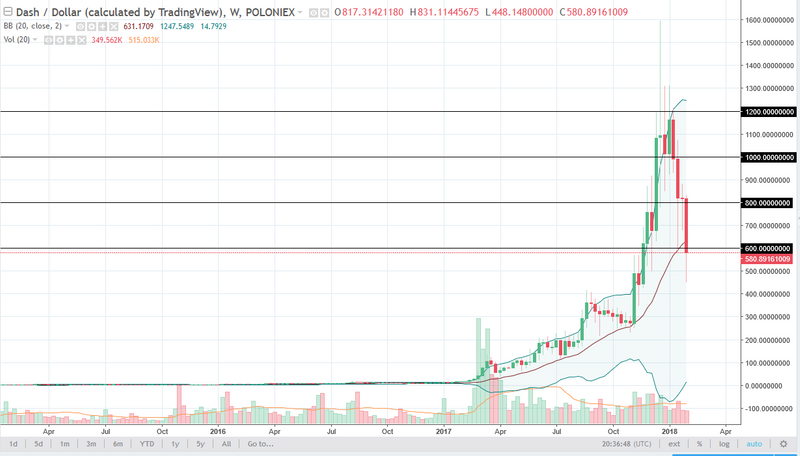
DASH
DASH traders sold off radically during the week, slicing through the $600 level, and then reaching towards the $500 level. We have broken the back of a hammer in this market, and that is almost always a negative sign. I think that given enough time, we should rally based upon a “dead cat bounce” as per usual, but I suggest that the $800 level will be massively resistive, as it is an area that was previously supportive. Otherwise, if we break down below the $500 level, we will continue to go much lower. Longer-term, I suspect that the DASH market returns to the $300 level.
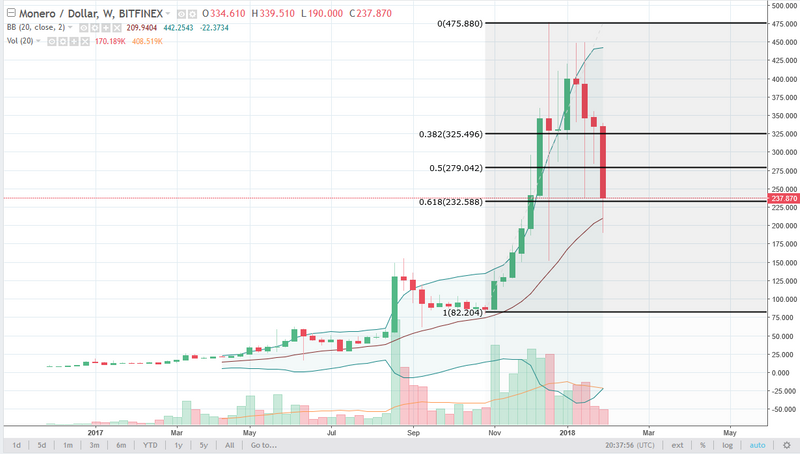
Monero
Monero markets fell hard during the week, breaking the back of the 50% Fibonacci retracement level, the hammer from the previous week, and then racing down towards the $200 level before finding support. Ultimately, this market continues to be a bit shocked by the recent trading volume, as it is almost nothing. Even with this massive selloff, not much in the way of volume was picked up, so I think this suggests that rallies will be selling opportunities, just as a break below the bottom of the weekly candle would be.
Buy & Sell Cryptocurrency Instantly
This article was originally posted on FX Empire
More From FXEMPIRE:
Alt Coins Price forecast for the week of February 5, 2018, Technical Analysis
Silver Price forecast for the week of February 5, 2018, Technical Analysis
Natural Gas forecast for the week of February 5, 2018, Technical Analysis
Bitcoin in the Red Again, as Investors Continue to Run for the Door
NZD/USD Price forecast for the week of February 5, 2018, Technical Analysis
