
 Yahoo Finance
 Alt Coins Price Forecast February 19, 2018, Technical Analysis
BTG/USD
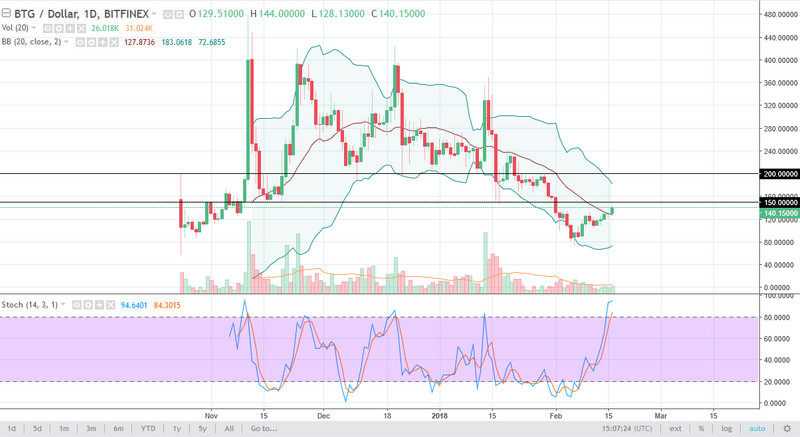
Bitcoin Gold rallied a bit during the trading session on Friday, breaking towards the 140 handle. The market has significant resistance at the $150 level above, and it’s likely that we will see some resistance in that area and perhaps even selling. I think that the alt coins need to see Bitcoin and a theory and take off to the upside, so I would be a bit cautious about buying a significant amount of Bitcoin Gold in the short term. If Bitcoin breaks to the upside against the US dollar, then Bitcoin Gold has an opportunity to rally towards the $200 level.
BTG/USD DASH USD and XMR USD Video 19.02.18
DASH/USD
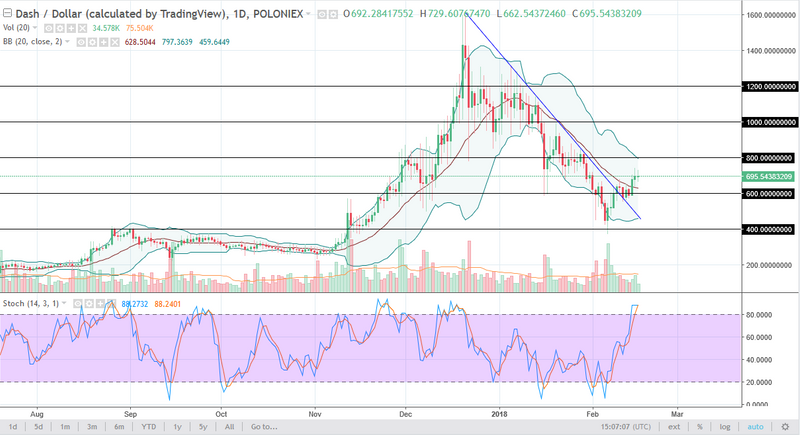
DASH traders did very little during the trading session on Friday, as we have seen the $700 level offer resistance. This is a neutral candle, and I think that it’s likely that we are going to drift down towards the $600 level, especially considering that Bitcoin and a theory in both look as if they are running into trouble. The $600 level underneath would be supportive, and I think that the market will find buyers in that area. The $800 level above is massive resistance, and I think that given enough time we will find sellers in that area as well. We’ve recently broke above a descending trend line, so that is one of the better signs for this market.
XMR/USD
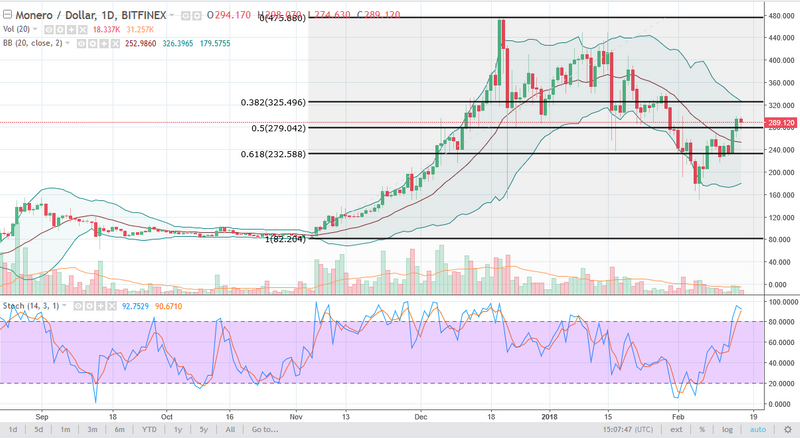
Monero fell during most of the session on Friday but found support at the $280 level to turn around and form a bit of a hammer. Because of this, looks as if the market is somewhat supportive but I also see a lot of resistance just above, especially near the $300 handle. Because of this, I like buying pullbacks, but I’m a bit hesitant to buy here.
Buy & Sell Cryptocurrency Instantly
This article was originally posted on FX Empire
