
 Yahoo Finance
 Allied Gold Full Year 2023 Earnings: EPS Misses Expectations
Allied Gold (TSE:AAUC) Full Year 2023 Results
Key Financial Results
Revenue: US$655.7m (down 2.1% from FY 2022).
Net loss: US$208.5m (loss widened by US$201.1m from FY 2022).
US$1.03 loss per share (further deteriorated from US$0.041 loss in FY 2022).
AAUC Production and Reserves
Gold
Production: 288.55 troy koz (311.49 troy koz in FY 2022)
Proved and probable reserves (ore): 237.9 Mt
Number of mines: 3
All figures shown in the chart above are for the trailing 12 month (TTM) period
Allied Gold EPS Misses Expectations
Revenue was in line with analyst estimates. Earnings per share (EPS) missed analyst estimates by 34%.
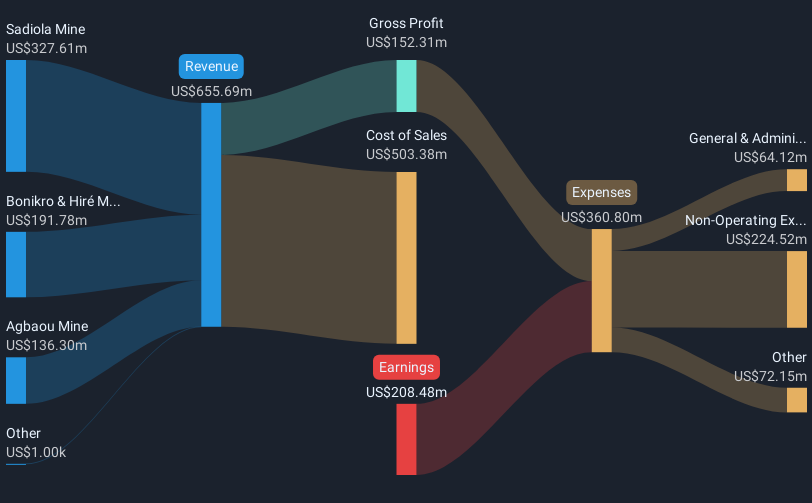
The primary driver behind last 12 months revenue was the Sadiola Mine segment contributing a total revenue of US$327.6m (50% of total revenue). Notably, cost of sales worth US$503.4m amounted to 77% of total revenue thereby underscoring the impact on earnings. The most substantial expense, totaling US$224.5m were related to Non-Operating costs. This indicates that a significant portion of the company's costs is related to non-core activities. Explore how AAUC's revenue and expenses shape its earnings.
Looking ahead, revenue is forecast to grow 16% p.a. on average during the next 3 years, compared to a 11% growth forecast for the Metals and Mining industry in Canada.
Performance of the Canadian Metals and Mining industry.
The company's shares are up 6.3% from a week ago.
Balance Sheet Analysis
While it's very important to consider the profit and loss statement, you can also learn a lot about a company by looking at its balance sheet. We've done some analysis and you can see our take on Allied Gold's balance sheet.
Have feedback on this article? Concerned about the content? Get in touch with us directly. Alternatively, email editorial-team (at) simplywallst.com.
This article by Simply Wall St is general in nature. We provide commentary based on historical data and analyst forecasts only using an unbiased methodology and our articles are not intended to be financial advice. It does not constitute a recommendation to buy or sell any stock, and does not take account of your objectives, or your financial situation. We aim to bring you long-term focused analysis driven by fundamental data. Note that our analysis may not factor in the latest price-sensitive company announcements or qualitative material. Simply Wall St has no position in any stocks mentioned.
