
 Yahoo Finance
 With A -37.85% Earnings Drop, Is Michelmersh Brick Holdings plc’s (LON:MBH) A Concern?

Increase in profitability and industry-beating performance can be essential considerations in a stock for some investors. In this article, I will take a look at Michelmersh Brick Holdings plc’s (LON:MBH) track record on a high level, to give you some insight into how the company has been performing against its historical trend and its industry peers. See our latest analysis for Michelmersh Brick Holdings
Was MBH weak performance lately part of a long-term decline?
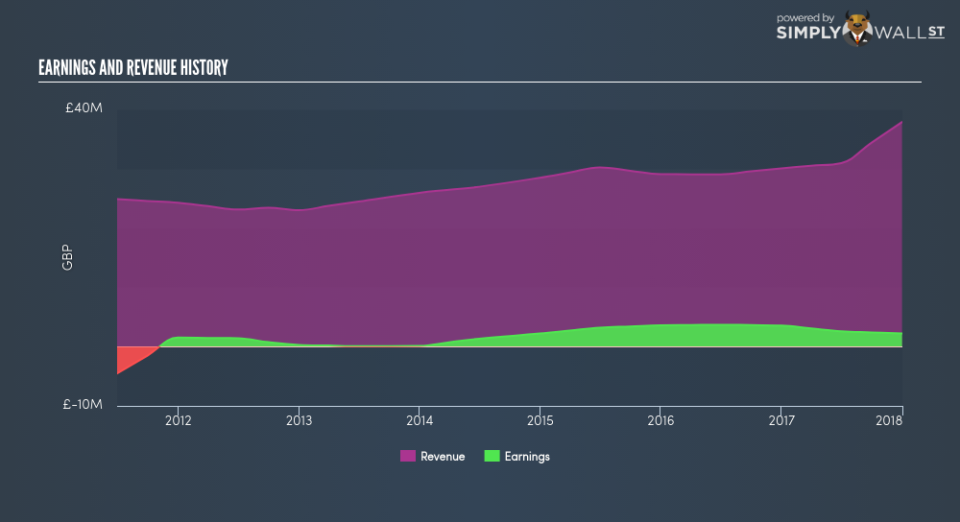
MBH’s trailing twelve-month earnings (from 31 December 2017) of UK£2.21m has declined by -37.85% compared to the previous year. Furthermore, this one-year growth rate has been lower than its average earnings growth rate over the past 5 years of 33.05%, indicating the rate at which MBH is growing has slowed down. What could be happening here? Let’s examine what’s going on with margins and whether the entire industry is experiencing the hit as well.
Over the last few years, revenue growth has fallen behind which indicates that Michelmersh Brick Holdings’s bottom line has been driven by unsustainable cost-cutting. Eyeballing growth from a sector-level, the UK basic materials industry has been amplifying average earnings growth of 53.87% in the past twelve months, and a strong 27.94% over the past half a decade. This means that any tailwind the industry is deriving benefit from, Michelmersh Brick Holdings has not been able to reap as much as its industry peers.
In terms of returns from investment, Michelmersh Brick Holdings has not invested its equity funds well, leading to a 3.72% return on equity (ROE), below the sensible minimum of 20%. Furthermore, its return on assets (ROA) of 2.62% is below the GB Basic Materials industry of 6.97%, indicating Michelmersh Brick Holdings’s are utilized less efficiently. However, its return on capital (ROC), which also accounts for Michelmersh Brick Holdings’s debt level, has increased over the past 3 years from 4.54% to 5.32%. This correlates with a decrease in debt holding, with debt-to-equity ratio declining from 51.94% to 36.37% over the past 5 years.
What does this mean?
Michelmersh Brick Holdings’s track record can be a valuable insight into its earnings performance, but it certainly doesn’t tell the whole story. Companies that are profitable, but have capricious earnings, can have many factors influencing its business. You should continue to research Michelmersh Brick Holdings to get a more holistic view of the stock by looking at:
Future Outlook: What are well-informed industry analysts predicting for MBH’s future growth? Take a look at our free research report of analyst consensus for MBH’s outlook.
Financial Health: Is MBH’s operations financially sustainable? Balance sheets can be hard to analyze, which is why we’ve done it for you. Check out our financial health checks here.
Other High-Performing Stocks: Are there other stocks that provide better prospects with proven track records? Explore our free list of these great stocks here.
NB: Figures in this article are calculated using data from the trailing twelve months from 31 December 2017. This may not be consistent with full year annual report figures.
To help readers see pass the short term volatility of the financial market, we aim to bring you a long-term focused research analysis purely driven by fundamental data. Note that our analysis does not factor in the latest price sensitive company announcements.
The author is an independent contributor and at the time of publication had no position in the stocks mentioned.
