
 Yahoo Finance
 YTL Corporation Berhad (KLSE:YTL) Is Looking To Continue Growing Its Returns On Capital
What are the early trends we should look for to identify a stock that could multiply in value over the long term? Ideally, a business will show two trends; firstly a growing return on capital employed (ROCE) and secondly, an increasing amount of capital employed. This shows us that it's a compounding machine, able to continually reinvest its earnings back into the business and generate higher returns. So on that note, YTL Corporation Berhad (KLSE:YTL) looks quite promising in regards to its trends of return on capital.
Understanding Return On Capital Employed (ROCE)
For those that aren't sure what ROCE is, it measures the amount of pre-tax profits a company can generate from the capital employed in its business. To calculate this metric for YTL Corporation Berhad, this is the formula:
Return on Capital Employed = Earnings Before Interest and Tax (EBIT) ÷ (Total Assets - Current Liabilities)
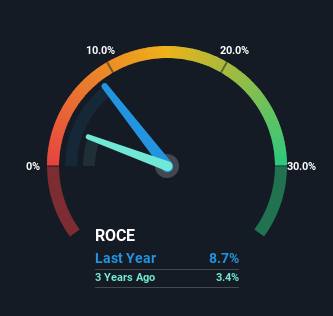
0.087 = RM5.9b ÷ (RM80b - RM12b) (Based on the trailing twelve months to September 2023).
Thus, YTL Corporation Berhad has an ROCE of 8.7%. In absolute terms, that's a low return, but it's much better than the Integrated Utilities industry average of 5.0%.
Check out our latest analysis for YTL Corporation Berhad
In the above chart we have measured YTL Corporation Berhad's prior ROCE against its prior performance, but the future is arguably more important. If you'd like to see what analysts are forecasting going forward, you should check out our free report for YTL Corporation Berhad.
The Trend Of ROCE
YTL Corporation Berhad has not disappointed with their ROCE growth. More specifically, while the company has kept capital employed relatively flat over the last five years, the ROCE has climbed 123% in that same time. So it's likely that the business is now reaping the full benefits of its past investments, since the capital employed hasn't changed considerably. It's worth looking deeper into this though because while it's great that the business is more efficient, it might also mean that going forward the areas to invest internally for the organic growth are lacking.
What We Can Learn From YTL Corporation Berhad's ROCE
To bring it all together, YTL Corporation Berhad has done well to increase the returns it's generating from its capital employed. And a remarkable 126% total return over the last five years tells us that investors are expecting more good things to come in the future. In light of that, we think it's worth looking further into this stock because if YTL Corporation Berhad can keep these trends up, it could have a bright future ahead.
YTL Corporation Berhad does come with some risks though, we found 3 warning signs in our investment analysis, and 2 of those are a bit unpleasant...
While YTL Corporation Berhad may not currently earn the highest returns, we've compiled a list of companies that currently earn more than 25% return on equity. Check out this free list here.
Have feedback on this article? Concerned about the content? Get in touch with us directly. Alternatively, email editorial-team (at) simplywallst.com.
This article by Simply Wall St is general in nature. We provide commentary based on historical data and analyst forecasts only using an unbiased methodology and our articles are not intended to be financial advice. It does not constitute a recommendation to buy or sell any stock, and does not take account of your objectives, or your financial situation. We aim to bring you long-term focused analysis driven by fundamental data. Note that our analysis may not factor in the latest price-sensitive company announcements or qualitative material. Simply Wall St has no position in any stocks mentioned.
