
 Yahoo Finance
 UOB-Kay Hian Holdings (SGX:U10) Is Increasing Its Dividend To SGD0.092
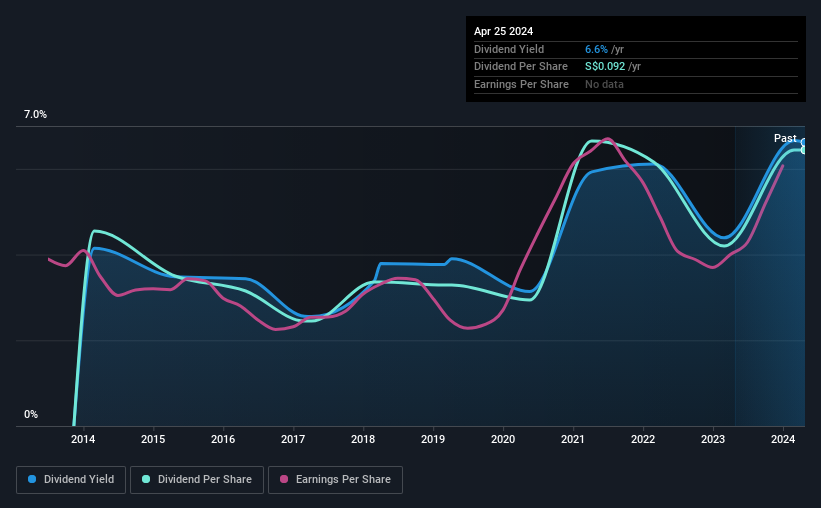
UOB-Kay Hian Holdings Limited (SGX:U10) has announced that it will be increasing its dividend from last year's comparable payment on the 26th of June to SGD0.092. This takes the dividend yield to 6.6%, which shareholders will be pleased with.
See our latest analysis for UOB-Kay Hian Holdings
UOB-Kay Hian Holdings' Earnings Easily Cover The Distributions
We like to see robust dividend yields, but that doesn't matter if the payment isn't sustainable. Based on the last payment, UOB-Kay Hian Holdings was quite comfortably earning enough to cover the dividend. This indicates that quite a large proportion of earnings is being invested back into the business.
If the trend of the last few years continues, EPS will grow by 15.1% over the next 12 months. If the dividend continues on this path, the payout ratio could be 45% by next year, which we think can be pretty sustainable going forward.
Dividend Volatility
The company's dividend history has been marked by instability, with at least one cut in the last 10 years. Since 2014, the dividend has gone from SGD0.065 total annually to SGD0.092. This means that it has been growing its distributions at 3.5% per annum over that time. It's encouraging to see some dividend growth, but the dividend has been cut at least once, and the size of the cut would eliminate most of the growth anyway, which makes this less attractive as an income investment.
The Dividend Looks Likely To Grow
Given that the dividend has been cut in the past, we need to check if earnings are growing and if that might lead to stronger dividends in the future. UOB-Kay Hian Holdings has impressed us by growing EPS at 15% per year over the past five years. Earnings are on the uptrend, and it is only paying a small portion of those earnings to shareholders.
UOB-Kay Hian Holdings Looks Like A Great Dividend Stock
Overall, we think this could be an attractive income stock, and it is only getting better by paying a higher dividend this year. The company is easily earning enough to cover its dividend payments and it is great to see that these earnings are being translated into cash flow. All of these factors considered, we think this has solid potential as a dividend stock.
Market movements attest to how highly valued a consistent dividend policy is compared to one which is more unpredictable. Still, investors need to consider a host of other factors, apart from dividend payments, when analysing a company. For instance, we've picked out 2 warning signs for UOB-Kay Hian Holdings that investors should take into consideration. If you are a dividend investor, you might also want to look at our curated list of high yield dividend stocks.
Have feedback on this article? Concerned about the content? Get in touch with us directly. Alternatively, email editorial-team (at) simplywallst.com.
This article by Simply Wall St is general in nature. We provide commentary based on historical data and analyst forecasts only using an unbiased methodology and our articles are not intended to be financial advice. It does not constitute a recommendation to buy or sell any stock, and does not take account of your objectives, or your financial situation. We aim to bring you long-term focused analysis driven by fundamental data. Note that our analysis may not factor in the latest price-sensitive company announcements or qualitative material. Simply Wall St has no position in any stocks mentioned.
