
 Yahoo Finance
 Sembcorp Industries (SGX:U96) shareholders have earned a 45% CAGR over the last three years
Sembcorp Industries Ltd (SGX:U96) shareholders have seen the share price descend 12% over the month. But that doesn't change the fact that the returns over the last three years have been very strong. In three years the stock price has launched 184% higher: a great result. After a run like that some may not be surprised to see prices moderate. The thing to consider is whether the underlying business is doing well enough to support the current price.
Let's take a look at the underlying fundamentals over the longer term, and see if they've been consistent with shareholders returns.
See our latest analysis for Sembcorp Industries
While markets are a powerful pricing mechanism, share prices reflect investor sentiment, not just underlying business performance. By comparing earnings per share (EPS) and share price changes over time, we can get a feel for how investor attitudes to a company have morphed over time.
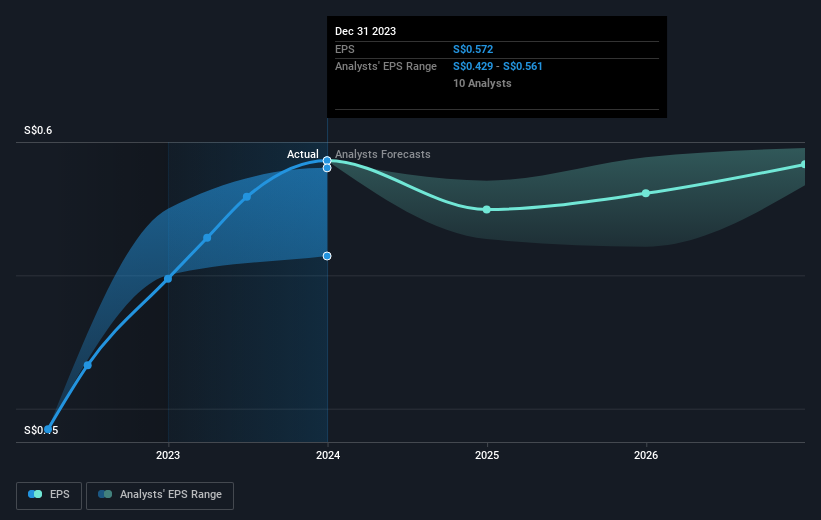
Sembcorp Industries was able to grow its EPS at 94% per year over three years, sending the share price higher. This EPS growth is higher than the 42% average annual increase in the share price. Therefore, it seems the market has moderated its expectations for growth, somewhat. We'd venture the lowish P/E ratio of 8.81 also reflects the negative sentiment around the stock.
You can see below how EPS has changed over time (discover the exact values by clicking on the image).
We know that Sembcorp Industries has improved its bottom line over the last three years, but what does the future have in store? You can see how its balance sheet has strengthened (or weakened) over time in this free interactive graphic.
What About Dividends?
When looking at investment returns, it is important to consider the difference between total shareholder return (TSR) and share price return. The TSR incorporates the value of any spin-offs or discounted capital raisings, along with any dividends, based on the assumption that the dividends are reinvested. Arguably, the TSR gives a more comprehensive picture of the return generated by a stock. We note that for Sembcorp Industries the TSR over the last 3 years was 207%, which is better than the share price return mentioned above. And there's no prize for guessing that the dividend payments largely explain the divergence!
A Different Perspective
It's good to see that Sembcorp Industries has rewarded shareholders with a total shareholder return of 27% in the last twelve months. That's including the dividend. Having said that, the five-year TSR of 35% a year, is even better. It's always interesting to track share price performance over the longer term. But to understand Sembcorp Industries better, we need to consider many other factors. Take risks, for example - Sembcorp Industries has 3 warning signs (and 1 which is a bit unpleasant) we think you should know about.
For those who like to find winning investments this free list of growing companies with recent insider purchasing, could be just the ticket.
Please note, the market returns quoted in this article reflect the market weighted average returns of stocks that currently trade on Singaporean exchanges.
Have feedback on this article? Concerned about the content? Get in touch with us directly. Alternatively, email editorial-team (at) simplywallst.com.
This article by Simply Wall St is general in nature. We provide commentary based on historical data and analyst forecasts only using an unbiased methodology and our articles are not intended to be financial advice. It does not constitute a recommendation to buy or sell any stock, and does not take account of your objectives, or your financial situation. We aim to bring you long-term focused analysis driven by fundamental data. Note that our analysis may not factor in the latest price-sensitive company announcements or qualitative material. Simply Wall St has no position in any stocks mentioned.