
 Yahoo Finance
 Returns At World Precision Machinery (SGX:B49) Are On The Way Up
What are the early trends we should look for to identify a stock that could multiply in value over the long term? Typically, we'll want to notice a trend of growing return on capital employed (ROCE) and alongside that, an expanding base of capital employed. This shows us that it's a compounding machine, able to continually reinvest its earnings back into the business and generate higher returns. Speaking of which, we noticed some great changes in World Precision Machinery's (SGX:B49) returns on capital, so let's have a look.
What Is Return On Capital Employed (ROCE)?
Just to clarify if you're unsure, ROCE is a metric for evaluating how much pre-tax income (in percentage terms) a company earns on the capital invested in its business. To calculate this metric for World Precision Machinery, this is the formula:
Return on Capital Employed = Earnings Before Interest and Tax (EBIT) ÷ (Total Assets - Current Liabilities)
0.00071 = CN¥834k ÷ (CN¥2.1b - CN¥933m) (Based on the trailing twelve months to March 2024).
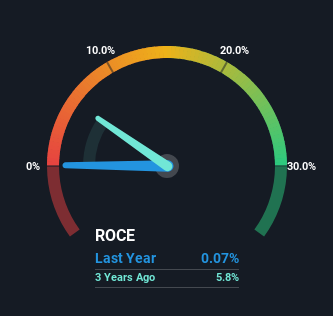
Therefore, World Precision Machinery has an ROCE of 0.07%. Ultimately, that's a low return and it under-performs the Machinery industry average of 6.8%.
See our latest analysis for World Precision Machinery
While the past is not representative of the future, it can be helpful to know how a company has performed historically, which is why we have this chart above. If you want to delve into the historical earnings , check out these free graphs detailing revenue and cash flow performance of World Precision Machinery.
What The Trend Of ROCE Can Tell Us
We're delighted to see that World Precision Machinery is reaping rewards from its investments and has now broken into profitability. The company was generating losses five years ago, but has managed to turn it around and as we saw earlier is now earning 0.07%, which is always encouraging. While returns have increased, the amount of capital employed by World Precision Machinery has remained flat over the period. With no noticeable increase in capital employed, it's worth knowing what the company plans on doing going forward in regards to reinvesting and growing the business. Because in the end, a business can only get so efficient.
For the record though, there was a noticeable increase in the company's current liabilities over the period, so we would attribute some of the ROCE growth to that. Effectively this means that suppliers or short-term creditors are now funding 44% of the business, which is more than it was five years ago. And with current liabilities at those levels, that's pretty high.
What We Can Learn From World Precision Machinery's ROCE
To bring it all together, World Precision Machinery has done well to increase the returns it's generating from its capital employed. And with the stock having performed exceptionally well over the last five years, these patterns are being accounted for by investors. Therefore, we think it would be worth your time to check if these trends are going to continue.
One more thing, we've spotted 1 warning sign facing World Precision Machinery that you might find interesting.
For those who like to invest in solid companies, check out this free list of companies with solid balance sheets and high returns on equity.
Have feedback on this article? Concerned about the content? Get in touch with us directly. Alternatively, email editorial-team (at) simplywallst.com.
This article by Simply Wall St is general in nature. We provide commentary based on historical data and analyst forecasts only using an unbiased methodology and our articles are not intended to be financial advice. It does not constitute a recommendation to buy or sell any stock, and does not take account of your objectives, or your financial situation. We aim to bring you long-term focused analysis driven by fundamental data. Note that our analysis may not factor in the latest price-sensitive company announcements or qualitative material. Simply Wall St has no position in any stocks mentioned.
