
 Yahoo Finance
 Can-One Berhad (KLSE:CANONE) Might Have The Makings Of A Multi-Bagger
If we want to find a stock that could multiply over the long term, what are the underlying trends we should look for? Typically, we'll want to notice a trend of growing return on capital employed (ROCE) and alongside that, an expanding base of capital employed. Basically this means that a company has profitable initiatives that it can continue to reinvest in, which is a trait of a compounding machine. Speaking of which, we noticed some great changes in Can-One Berhad's (KLSE:CANONE) returns on capital, so let's have a look.
Understanding Return On Capital Employed (ROCE)
If you haven't worked with ROCE before, it measures the 'return' (pre-tax profit) a company generates from capital employed in its business. To calculate this metric for Can-One Berhad, this is the formula:
Return on Capital Employed = Earnings Before Interest and Tax (EBIT) ÷ (Total Assets - Current Liabilities)
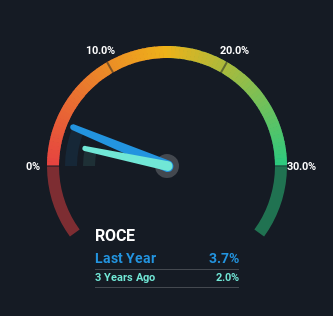
0.037 = RM115m ÷ (RM4.5b - RM1.4b) (Based on the trailing twelve months to December 2023).
So, Can-One Berhad has an ROCE of 3.7%. In absolute terms, that's a low return and it also under-performs the Packaging industry average of 9.4%.
View our latest analysis for Can-One Berhad
While the past is not representative of the future, it can be helpful to know how a company has performed historically, which is why we have this chart above. If you want to delve into the historical earnings , check out these free graphs detailing revenue and cash flow performance of Can-One Berhad.
The Trend Of ROCE
While in absolute terms it isn't a high ROCE, it's promising to see that it has been moving in the right direction. The data shows that returns on capital have increased substantially over the last five years to 3.7%. The amount of capital employed has increased too, by 169%. This can indicate that there's plenty of opportunities to invest capital internally and at ever higher rates, a combination that's common among multi-baggers.
In Conclusion...
In summary, it's great to see that Can-One Berhad can compound returns by consistently reinvesting capital at increasing rates of return, because these are some of the key ingredients of those highly sought after multi-baggers. Astute investors may have an opportunity here because the stock has declined 13% in the last five years. So researching this company further and determining whether or not these trends will continue seems justified.
One final note, you should learn about the 2 warning signs we've spotted with Can-One Berhad (including 1 which is a bit unpleasant) .
While Can-One Berhad isn't earning the highest return, check out this free list of companies that are earning high returns on equity with solid balance sheets.
Have feedback on this article? Concerned about the content? Get in touch with us directly. Alternatively, email editorial-team (at) simplywallst.com.
This article by Simply Wall St is general in nature. We provide commentary based on historical data and analyst forecasts only using an unbiased methodology and our articles are not intended to be financial advice. It does not constitute a recommendation to buy or sell any stock, and does not take account of your objectives, or your financial situation. We aim to bring you long-term focused analysis driven by fundamental data. Note that our analysis may not factor in the latest price-sensitive company announcements or qualitative material. Simply Wall St has no position in any stocks mentioned.
