
 Yahoo Finance
 NSL (SGX:N02) Is Doing The Right Things To Multiply Its Share Price
If you're not sure where to start when looking for the next multi-bagger, there are a few key trends you should keep an eye out for. Firstly, we'd want to identify a growing return on capital employed (ROCE) and then alongside that, an ever-increasing base of capital employed. This shows us that it's a compounding machine, able to continually reinvest its earnings back into the business and generate higher returns. So on that note, NSL (SGX:N02) looks quite promising in regards to its trends of return on capital.
Return On Capital Employed (ROCE): What Is It?
If you haven't worked with ROCE before, it measures the 'return' (pre-tax profit) a company generates from capital employed in its business. Analysts use this formula to calculate it for NSL:
Return on Capital Employed = Earnings Before Interest and Tax (EBIT) ÷ (Total Assets - Current Liabilities)
0.05 = S$15m ÷ (S$384m - S$79m) (Based on the trailing twelve months to December 2023).
Thus, NSL has an ROCE of 5.0%. Ultimately, that's a low return and it under-performs the Basic Materials industry average of 7.6%.
Check out our latest analysis for NSL
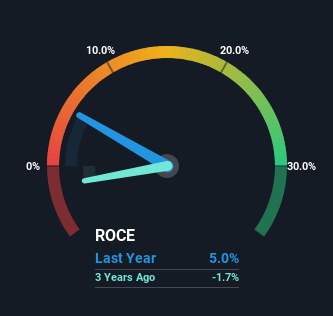
Historical performance is a great place to start when researching a stock so above you can see the gauge for NSL's ROCE against it's prior returns. If you want to delve into the historical earnings , check out these free graphs detailing revenue and cash flow performance of NSL.
What Can We Tell From NSL's ROCE Trend?
We're delighted to see that NSL is reaping rewards from its investments and has now broken into profitability. While the business is profitable now, it used to be incurring losses on invested capital five years ago. Additionally, the business is utilizing 49% less capital than it was five years ago, and taken at face value, that can mean the company needs less funds at work to get a return. The reduction could indicate that the company is selling some assets, and considering returns are up, they appear to be selling the right ones.
What We Can Learn From NSL's ROCE
In a nutshell, we're pleased to see that NSL has been able to generate higher returns from less capital. Considering the stock has delivered 27% to its stockholders over the last five years, it may be fair to think that investors aren't fully aware of the promising trends yet. Given that, we'd look further into this stock in case it has more traits that could make it multiply in the long term.
If you want to continue researching NSL, you might be interested to know about the 1 warning sign that our analysis has discovered.
While NSL isn't earning the highest return, check out this free list of companies that are earning high returns on equity with solid balance sheets.
Have feedback on this article? Concerned about the content? Get in touch with us directly. Alternatively, email editorial-team (at) simplywallst.com.
This article by Simply Wall St is general in nature. We provide commentary based on historical data and analyst forecasts only using an unbiased methodology and our articles are not intended to be financial advice. It does not constitute a recommendation to buy or sell any stock, and does not take account of your objectives, or your financial situation. We aim to bring you long-term focused analysis driven by fundamental data. Note that our analysis may not factor in the latest price-sensitive company announcements or qualitative material. Simply Wall St has no position in any stocks mentioned.
