
 Yahoo Finance
 Natural Gas- Weekly Outlook for February 4th 2014
Highlights:
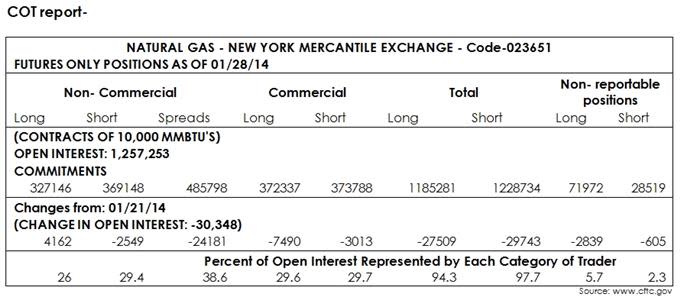
U.S. natural gas storage was at 2.193 trillion cubic feet, down by 637 billion cubic feet compared to the previous year.
The 5- year average stood at 437 billion cubic feet, much lower than the five-year average of 2.630 trillion cubic feet around this time of the year.
Expect prices to remain volatile over the next few weeks as unpredictable weather conditions continue to play havoc.
NYMEX Natural gas for March delivery ended the week at $4.9050 slumping by 4.61% and capping two successive weekly gains. Prices remained extremely volatile with natural gas rallying close to its 48- month highs mid-way last week before slumping close to 10% from its weekly highs.
Natural gas opened last Monday slightly in the negative, hit intra-day highs of $5.4420, before sliding sharply to close at $4.8470. However, prices rallied for the next couple of days to fresh 4- year highs due to severe cold weather conditions prevailing in the U.S. However, after the U.S. Energy Information Administration released its weekly natural gas storage report on Thursday, which showed storage for the week ending January 24th fell by 230 billion cubic feet and slightly above analyst’s expectation of a 236 billion cubic feet drop.
Prices started sliding before finding support near $4.7000 per MMBTU. U.S. natural gas storage was at 2.193 trillion cubic feet, down by 637 billion cubic feet compared to the previous year. The 5- year average stood at 437 billion cubic feet, much lower than the five-year average of 2.630 trillion cubic feet around this time of the year. Expect prices to remain volatile over the next few weeks as unpredictable weather conditions continue to play havoc.
The week ahead
Technical view:
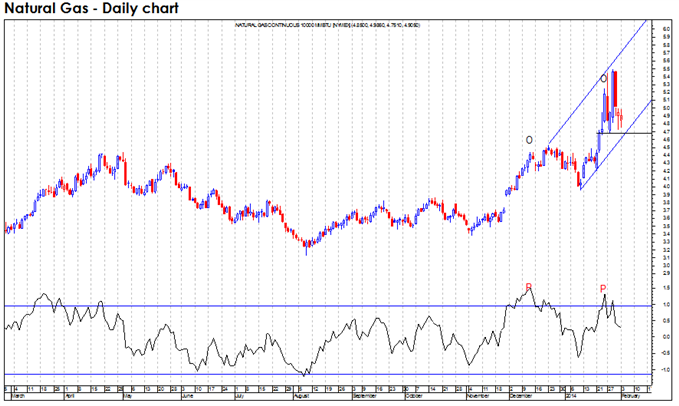
Natural gas for March delivery settled at $4.9050 a MMBTU on Monday, down 0.77 percent for the session, rebounding from its session lows. Although the overall trend remains bearish, there is a possibility of prices breaching the previous week’s highs and testing near term resistances at $5.7500, where the short-term upside is likely to be capped. For the week, natural gas could oscillate within the short term bullish channel at $4.6500- 5.7500; trend lines connecting the lows of January this year and the highs of December last year. However, close below $4.6500; expect prices to slump to $4.2000.
Strategy:
For the week, short Natural gas on rallies from prices ranging from $5.4500- 5.7500 per MMBTU.
DailyFX provides forex news and technical analysis on the trends that influence the global currency markets.
Learn forex trading with a free practice account and trading charts from FXCM.
