
 Yahoo Finance
 Nanofilm Technologies International (SGX:MZH) Might Be Having Difficulty Using Its Capital Effectively
What are the early trends we should look for to identify a stock that could multiply in value over the long term? Firstly, we'd want to identify a growing return on capital employed (ROCE) and then alongside that, an ever-increasing base of capital employed. Ultimately, this demonstrates that it's a business that is reinvesting profits at increasing rates of return. Having said that, from a first glance at Nanofilm Technologies International (SGX:MZH) we aren't jumping out of our chairs at how returns are trending, but let's have a deeper look.
What Is Return On Capital Employed (ROCE)?
For those who don't know, ROCE is a measure of a company's yearly pre-tax profit (its return), relative to the capital employed in the business. The formula for this calculation on Nanofilm Technologies International is:
Return on Capital Employed = Earnings Before Interest and Tax (EBIT) ÷ (Total Assets - Current Liabilities)
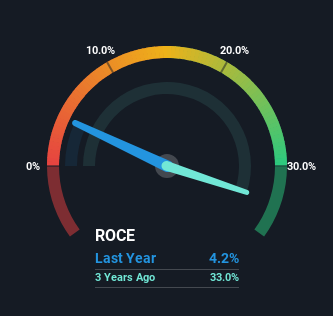
0.042 = S$22m ÷ (S$557m - S$41m) (Based on the trailing twelve months to June 2023).
So, Nanofilm Technologies International has an ROCE of 4.2%. On its own that's a low return, but compared to the average of 1.8% generated by the Chemicals industry, it's much better.
Check out our latest analysis for Nanofilm Technologies International
Above you can see how the current ROCE for Nanofilm Technologies International compares to its prior returns on capital, but there's only so much you can tell from the past. If you'd like, you can check out the forecasts from the analysts covering Nanofilm Technologies International here for free.
How Are Returns Trending?
When we looked at the ROCE trend at Nanofilm Technologies International, we didn't gain much confidence. To be more specific, ROCE has fallen from 27% over the last five years. Given the business is employing more capital while revenue has slipped, this is a bit concerning. This could mean that the business is losing its competitive advantage or market share, because while more money is being put into ventures, it's actually producing a lower return - "less bang for their buck" per se.
On a related note, Nanofilm Technologies International has decreased its current liabilities to 7.4% of total assets. So we could link some of this to the decrease in ROCE. What's more, this can reduce some aspects of risk to the business because now the company's suppliers or short-term creditors are funding less of its operations. Since the business is basically funding more of its operations with it's own money, you could argue this has made the business less efficient at generating ROCE.
The Bottom Line On Nanofilm Technologies International's ROCE
In summary, we're somewhat concerned by Nanofilm Technologies International's diminishing returns on increasing amounts of capital. We expect this has contributed to the stock plummeting 86% during the last three years. With underlying trends that aren't great in these areas, we'd consider looking elsewhere.
Nanofilm Technologies International does have some risks though, and we've spotted 1 warning sign for Nanofilm Technologies International that you might be interested in.
If you want to search for solid companies with great earnings, check out this free list of companies with good balance sheets and impressive returns on equity.
Have feedback on this article? Concerned about the content? Get in touch with us directly. Alternatively, email editorial-team (at) simplywallst.com.
This article by Simply Wall St is general in nature. We provide commentary based on historical data and analyst forecasts only using an unbiased methodology and our articles are not intended to be financial advice. It does not constitute a recommendation to buy or sell any stock, and does not take account of your objectives, or your financial situation. We aim to bring you long-term focused analysis driven by fundamental data. Note that our analysis may not factor in the latest price-sensitive company announcements or qualitative material. Simply Wall St has no position in any stocks mentioned.
