
 Yahoo Finance
 Here's What's Concerning About HRnetGroup's (SGX:CHZ) Returns On Capital
To avoid investing in a business that's in decline, there's a few financial metrics that can provide early indications of aging. More often than not, we'll see a declining return on capital employed (ROCE) and a declining amount of capital employed. This indicates the company is producing less profit from its investments and its total assets are decreasing. On that note, looking into HRnetGroup (SGX:CHZ), we weren't too upbeat about how things were going.
What Is Return On Capital Employed (ROCE)?
Just to clarify if you're unsure, ROCE is a metric for evaluating how much pre-tax income (in percentage terms) a company earns on the capital invested in its business. The formula for this calculation on HRnetGroup is:
Return on Capital Employed = Earnings Before Interest and Tax (EBIT) ÷ (Total Assets - Current Liabilities)
0.14 = S$54m ÷ (S$480m - S$81m) (Based on the trailing twelve months to December 2023).
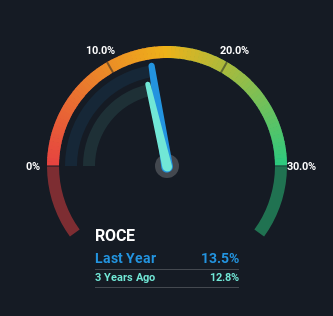
Therefore, HRnetGroup has an ROCE of 14%. In absolute terms, that's a pretty standard return but compared to the Professional Services industry average it falls behind.
View our latest analysis for HRnetGroup
In the above chart we have measured HRnetGroup's prior ROCE against its prior performance, but the future is arguably more important. If you'd like to see what analysts are forecasting going forward, you should check out our free analyst report for HRnetGroup .
So How Is HRnetGroup's ROCE Trending?
There is reason to be cautious about HRnetGroup, given the returns are trending downwards. About five years ago, returns on capital were 18%, however they're now substantially lower than that as we saw above. Meanwhile, capital employed in the business has stayed roughly the flat over the period. Companies that exhibit these attributes tend to not be shrinking, but they can be mature and facing pressure on their margins from competition. So because these trends aren't typically conducive to creating a multi-bagger, we wouldn't hold our breath on HRnetGroup becoming one if things continue as they have.
Our Take On HRnetGroup's ROCE
All in all, the lower returns from the same amount of capital employed aren't exactly signs of a compounding machine. In spite of that, the stock has delivered a 16% return to shareholders who held over the last five years. Regardless, we don't like the trends as they are and if they persist, we think you might find better investments elsewhere.
If you'd like to know more about HRnetGroup, we've spotted 2 warning signs, and 1 of them is concerning.
For those who like to invest in solid companies, check out this free list of companies with solid balance sheets and high returns on equity.
Have feedback on this article? Concerned about the content? Get in touch with us directly. Alternatively, email editorial-team (at) simplywallst.com.
This article by Simply Wall St is general in nature. We provide commentary based on historical data and analyst forecasts only using an unbiased methodology and our articles are not intended to be financial advice. It does not constitute a recommendation to buy or sell any stock, and does not take account of your objectives, or your financial situation. We aim to bring you long-term focused analysis driven by fundamental data. Note that our analysis may not factor in the latest price-sensitive company announcements or qualitative material. Simply Wall St has no position in any stocks mentioned.
