
 Yahoo Finance
 Here's What To Make Of TalkMed Group's (SGX:5G3) Decelerating Rates Of Return
What trends should we look for it we want to identify stocks that can multiply in value over the long term? In a perfect world, we'd like to see a company investing more capital into its business and ideally the returns earned from that capital are also increasing. This shows us that it's a compounding machine, able to continually reinvest its earnings back into the business and generate higher returns. Having said that, while the ROCE is currently high for TalkMed Group (SGX:5G3), we aren't jumping out of our chairs because returns are decreasing.
Understanding Return On Capital Employed (ROCE)
Just to clarify if you're unsure, ROCE is a metric for evaluating how much pre-tax income (in percentage terms) a company earns on the capital invested in its business. Analysts use this formula to calculate it for TalkMed Group:
Return on Capital Employed = Earnings Before Interest and Tax (EBIT) ÷ (Total Assets - Current Liabilities)
0.48 = S$40m ÷ (S$106m - S$23m) (Based on the trailing twelve months to June 2023).
So, TalkMed Group has an ROCE of 48%. That's a fantastic return and not only that, it outpaces the average of 7.6% earned by companies in a similar industry.
See our latest analysis for TalkMed Group
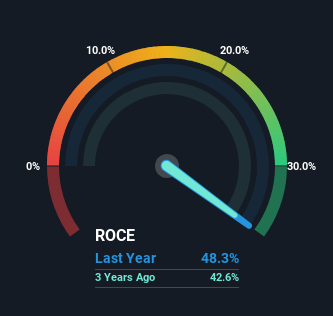
Historical performance is a great place to start when researching a stock so above you can see the gauge for TalkMed Group's ROCE against it's prior returns. If you'd like to look at how TalkMed Group has performed in the past in other metrics, you can view this free graph of past earnings, revenue and cash flow.
How Are Returns Trending?
Things have been pretty stable at TalkMed Group, with its capital employed and returns on that capital staying somewhat the same for the last five years. This tells us the company isn't reinvesting in itself, so it's plausible that it's past the growth phase. So while the current operations are delivering respectable returns, unless capital employed increases we'd be hard-pressed to believe it's a multi-bagger going forward.
In Conclusion...
Although is allocating it's capital efficiently to generate impressive returns, it isn't compounding its base of capital, which is what we'd see from a multi-bagger. And investors appear hesitant that the trends will pick up because the stock has fallen 17% in the last five years. All in all, the inherent trends aren't typical of multi-baggers, so if that's what you're after, we think you might have more luck elsewhere.
Since virtually every company faces some risks, it's worth knowing what they are, and we've spotted 2 warning signs for TalkMed Group (of which 1 doesn't sit too well with us!) that you should know about.
If you'd like to see other companies earning high returns, check out our free list of companies earning high returns with solid balance sheets here.
Have feedback on this article? Concerned about the content? Get in touch with us directly. Alternatively, email editorial-team (at) simplywallst.com.
This article by Simply Wall St is general in nature. We provide commentary based on historical data and analyst forecasts only using an unbiased methodology and our articles are not intended to be financial advice. It does not constitute a recommendation to buy or sell any stock, and does not take account of your objectives, or your financial situation. We aim to bring you long-term focused analysis driven by fundamental data. Note that our analysis may not factor in the latest price-sensitive company announcements or qualitative material. Simply Wall St has no position in any stocks mentioned.