
 Yahoo Finance
 Hafary Holdings (SGX:5VS) Shareholders Will Want The ROCE Trajectory To Continue
Did you know there are some financial metrics that can provide clues of a potential multi-bagger? Firstly, we'll want to see a proven return on capital employed (ROCE) that is increasing, and secondly, an expanding base of capital employed. This shows us that it's a compounding machine, able to continually reinvest its earnings back into the business and generate higher returns. So on that note, Hafary Holdings (SGX:5VS) looks quite promising in regards to its trends of return on capital.
What Is Return On Capital Employed (ROCE)?
For those who don't know, ROCE is a measure of a company's yearly pre-tax profit (its return), relative to the capital employed in the business. Analysts use this formula to calculate it for Hafary Holdings:
Return on Capital Employed = Earnings Before Interest and Tax (EBIT) ÷ (Total Assets - Current Liabilities)
0.16 = S$48m ÷ (S$443m - S$147m) (Based on the trailing twelve months to June 2023).
Thus, Hafary Holdings has an ROCE of 16%. In absolute terms, that's a satisfactory return, but compared to the Trade Distributors industry average of 8.6% it's much better.
See our latest analysis for Hafary Holdings
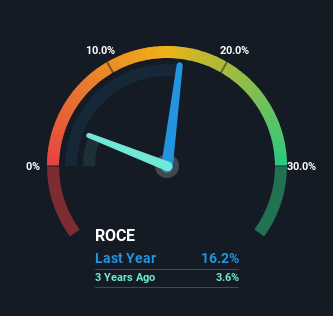
Historical performance is a great place to start when researching a stock so above you can see the gauge for Hafary Holdings' ROCE against it's prior returns. If you'd like to look at how Hafary Holdings has performed in the past in other metrics, you can view this free graph of past earnings, revenue and cash flow.
What The Trend Of ROCE Can Tell Us
We like the trends that we're seeing from Hafary Holdings. Over the last five years, returns on capital employed have risen substantially to 16%. Basically the business is earning more per dollar of capital invested and in addition to that, 99% more capital is being employed now too. This can indicate that there's plenty of opportunities to invest capital internally and at ever higher rates, a combination that's common among multi-baggers.
The Bottom Line On Hafary Holdings' ROCE
To sum it up, Hafary Holdings has proven it can reinvest in the business and generate higher returns on that capital employed, which is terrific. And with the stock having performed exceptionally well over the last five years, these patterns are being accounted for by investors. Therefore, we think it would be worth your time to check if these trends are going to continue.
Since virtually every company faces some risks, it's worth knowing what they are, and we've spotted 4 warning signs for Hafary Holdings (of which 2 shouldn't be ignored!) that you should know about.
For those who like to invest in solid companies, check out this free list of companies with solid balance sheets and high returns on equity.
Have feedback on this article? Concerned about the content? Get in touch with us directly. Alternatively, email editorial-team (at) simplywallst.com.
This article by Simply Wall St is general in nature. We provide commentary based on historical data and analyst forecasts only using an unbiased methodology and our articles are not intended to be financial advice. It does not constitute a recommendation to buy or sell any stock, and does not take account of your objectives, or your financial situation. We aim to bring you long-term focused analysis driven by fundamental data. Note that our analysis may not factor in the latest price-sensitive company announcements or qualitative material. Simply Wall St has no position in any stocks mentioned.
