
 Yahoo Finance
 Cepatwawasan Group Berhad (KLSE:CEPAT) Is Looking To Continue Growing Its Returns On Capital
Finding a business that has the potential to grow substantially is not easy, but it is possible if we look at a few key financial metrics. In a perfect world, we'd like to see a company investing more capital into its business and ideally the returns earned from that capital are also increasing. This shows us that it's a compounding machine, able to continually reinvest its earnings back into the business and generate higher returns. So on that note, Cepatwawasan Group Berhad (KLSE:CEPAT) looks quite promising in regards to its trends of return on capital.
Return On Capital Employed (ROCE): What Is It?
If you haven't worked with ROCE before, it measures the 'return' (pre-tax profit) a company generates from capital employed in its business. Analysts use this formula to calculate it for Cepatwawasan Group Berhad:
Return on Capital Employed = Earnings Before Interest and Tax (EBIT) ÷ (Total Assets - Current Liabilities)
0.068 = RM31m ÷ (RM500m - RM37m) (Based on the trailing twelve months to December 2023).
Therefore, Cepatwawasan Group Berhad has an ROCE of 6.8%. On its own that's a low return on capital but it's in line with the industry's average returns of 6.9%.
Check out our latest analysis for Cepatwawasan Group Berhad
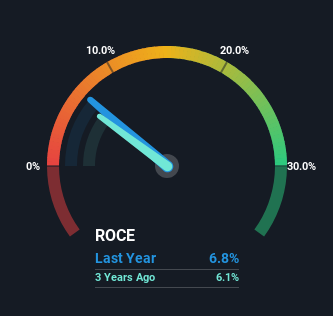
Historical performance is a great place to start when researching a stock so above you can see the gauge for Cepatwawasan Group Berhad's ROCE against it's prior returns. If you want to delve into the historical earnings , check out these free graphs detailing revenue and cash flow performance of Cepatwawasan Group Berhad.
So How Is Cepatwawasan Group Berhad's ROCE Trending?
Cepatwawasan Group Berhad has not disappointed with their ROCE growth. The figures show that over the last five years, ROCE has grown 475% whilst employing roughly the same amount of capital. So our take on this is that the business has increased efficiencies to generate these higher returns, all the while not needing to make any additional investments. It's worth looking deeper into this though because while it's great that the business is more efficient, it might also mean that going forward the areas to invest internally for the organic growth are lacking.
The Bottom Line
In summary, we're delighted to see that Cepatwawasan Group Berhad has been able to increase efficiencies and earn higher rates of return on the same amount of capital. And with a respectable 56% awarded to those who held the stock over the last five years, you could argue that these developments are starting to get the attention they deserve. With that being said, we still think the promising fundamentals mean the company deserves some further due diligence.
One more thing, we've spotted 2 warning signs facing Cepatwawasan Group Berhad that you might find interesting.
If you want to search for solid companies with great earnings, check out this free list of companies with good balance sheets and impressive returns on equity.
Have feedback on this article? Concerned about the content? Get in touch with us directly. Alternatively, email editorial-team (at) simplywallst.com.
This article by Simply Wall St is general in nature. We provide commentary based on historical data and analyst forecasts only using an unbiased methodology and our articles are not intended to be financial advice. It does not constitute a recommendation to buy or sell any stock, and does not take account of your objectives, or your financial situation. We aim to bring you long-term focused analysis driven by fundamental data. Note that our analysis may not factor in the latest price-sensitive company announcements or qualitative material. Simply Wall St has no position in any stocks mentioned.
