
 Yahoo Finance
 ZICO Holdings Inc.'s (Catalist:40W) Price Is Out Of Tune With Revenues
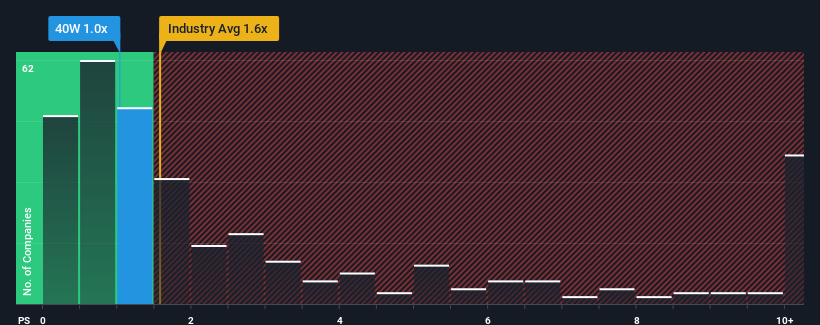
With a median price-to-sales (or "P/S") ratio of close to 1.1x in the Professional Services industry in Singapore, you could be forgiven for feeling indifferent about ZICO Holdings Inc.'s (Catalist:40W) P/S ratio of 1x. Although, it's not wise to simply ignore the P/S without explanation as investors may be disregarding a distinct opportunity or a costly mistake.
Check out our latest analysis for ZICO Holdings
How Has ZICO Holdings Performed Recently?
ZICO Holdings has been doing a good job lately as it's been growing revenue at a solid pace. One possibility is that the P/S is moderate because investors think this respectable revenue growth might not be enough to outperform the broader industry in the near future. If that doesn't eventuate, then existing shareholders probably aren't too pessimistic about the future direction of the share price.
Although there are no analyst estimates available for ZICO Holdings, take a look at this free data-rich visualisation to see how the company stacks up on earnings, revenue and cash flow.
How Is ZICO Holdings' Revenue Growth Trending?
There's an inherent assumption that a company should be matching the industry for P/S ratios like ZICO Holdings' to be considered reasonable.
Taking a look back first, we see that the company managed to grow revenues by a handy 14% last year. Still, lamentably revenue has fallen 2.7% in aggregate from three years ago, which is disappointing. Accordingly, shareholders would have felt downbeat about the medium-term rates of revenue growth.
Weighing that medium-term revenue trajectory against the broader industry's one-year forecast for expansion of 10.0% shows it's an unpleasant look.
With this in mind, we find it worrying that ZICO Holdings' P/S exceeds that of its industry peers. It seems most investors are ignoring the recent poor growth rate and are hoping for a turnaround in the company's business prospects. Only the boldest would assume these prices are sustainable as a continuation of recent revenue trends is likely to weigh on the share price eventually.
What We Can Learn From ZICO Holdings' P/S?
Typically, we'd caution against reading too much into price-to-sales ratios when settling on investment decisions, though it can reveal plenty about what other market participants think about the company.
Our look at ZICO Holdings revealed its shrinking revenues over the medium-term haven't impacted the P/S as much as we anticipated, given the industry is set to grow. Even though it matches the industry, we're uncomfortable with the current P/S ratio, as this dismal revenue performance is unlikely to support a more positive sentiment for long. If recent medium-term revenue trends continue, it will place shareholders' investments at risk and potential investors in danger of paying an unnecessary premium.
Having said that, be aware ZICO Holdings is showing 4 warning signs in our investment analysis, and 2 of those are potentially serious.
If companies with solid past earnings growth is up your alley, you may wish to see this free collection of other companies with strong earnings growth and low P/E ratios.
Have feedback on this article? Concerned about the content? Get in touch with us directly. Alternatively, email editorial-team (at) simplywallst.com.
This article by Simply Wall St is general in nature. We provide commentary based on historical data and analyst forecasts only using an unbiased methodology and our articles are not intended to be financial advice. It does not constitute a recommendation to buy or sell any stock, and does not take account of your objectives, or your financial situation. We aim to bring you long-term focused analysis driven by fundamental data. Note that our analysis may not factor in the latest price-sensitive company announcements or qualitative material. Simply Wall St has no position in any stocks mentioned.
