
 Yahoo Finance
 Returns On Capital Are Showing Encouraging Signs At Entergy (NYSE:ETR)
If we want to find a potential multi-bagger, often there are underlying trends that can provide clues. Firstly, we'll want to see a proven return on capital employed (ROCE) that is increasing, and secondly, an expanding base of capital employed. This shows us that it's a compounding machine, able to continually reinvest its earnings back into the business and generate higher returns. Speaking of which, we noticed some great changes in Entergy's (NYSE:ETR) returns on capital, so let's have a look.
What Is Return On Capital Employed (ROCE)?
If you haven't worked with ROCE before, it measures the 'return' (pre-tax profit) a company generates from capital employed in its business. Analysts use this formula to calculate it for Entergy:
Return on Capital Employed = Earnings Before Interest and Tax (EBIT) ÷ (Total Assets - Current Liabilities)
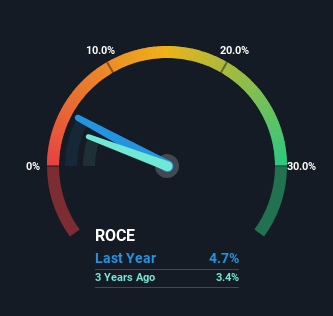
0.047 = US$2.6b ÷ (US$62b - US$6.9b) (Based on the trailing twelve months to March 2024).
So, Entergy has an ROCE of 4.7%. On its own that's a low return on capital but it's in line with the industry's average returns of 4.8%.
View our latest analysis for Entergy
In the above chart we have measured Entergy's prior ROCE against its prior performance, but the future is arguably more important. If you'd like to see what analysts are forecasting going forward, you should check out our free analyst report for Entergy .
What Does the ROCE Trend For Entergy Tell Us?
Even though ROCE is still low in absolute terms, it's good to see it's heading in the right direction. The numbers show that in the last five years, the returns generated on capital employed have grown considerably to 4.7%. The company is effectively making more money per dollar of capital used, and it's worth noting that the amount of capital has increased too, by 22%. This can indicate that there's plenty of opportunities to invest capital internally and at ever higher rates, a combination that's common among multi-baggers.
In Conclusion...
A company that is growing its returns on capital and can consistently reinvest in itself is a highly sought after trait, and that's what Entergy has. Investors may not be impressed by the favorable underlying trends yet because over the last five years the stock has only returned 29% to shareholders. So exploring more about this stock could uncover a good opportunity, if the valuation and other metrics stack up.
If you want to know some of the risks facing Entergy we've found 3 warning signs (1 is significant!) that you should be aware of before investing here.
While Entergy may not currently earn the highest returns, we've compiled a list of companies that currently earn more than 25% return on equity. Check out this free list here.
Have feedback on this article? Concerned about the content? Get in touch with us directly. Alternatively, email editorial-team (at) simplywallst.com.
This article by Simply Wall St is general in nature. We provide commentary based on historical data and analyst forecasts only using an unbiased methodology and our articles are not intended to be financial advice. It does not constitute a recommendation to buy or sell any stock, and does not take account of your objectives, or your financial situation. We aim to bring you long-term focused analysis driven by fundamental data. Note that our analysis may not factor in the latest price-sensitive company announcements or qualitative material. Simply Wall St has no position in any stocks mentioned.