
 Yahoo Finance
 Manhattan Associates (NASDAQ:MANH) shareholders have earned a 28% CAGR over the last five years
The most you can lose on any stock (assuming you don't use leverage) is 100% of your money. But on the bright side, if you buy shares in a high quality company at the right price, you can gain well over 100%. One great example is Manhattan Associates, Inc. (NASDAQ:MANH) which saw its share price drive 244% higher over five years. In the last week the share price is up 1.0%.
So let's investigate and see if the longer term performance of the company has been in line with the underlying business' progress.
Check out our latest analysis for Manhattan Associates
There is no denying that markets are sometimes efficient, but prices do not always reflect underlying business performance. One imperfect but simple way to consider how the market perception of a company has shifted is to compare the change in the earnings per share (EPS) with the share price movement.
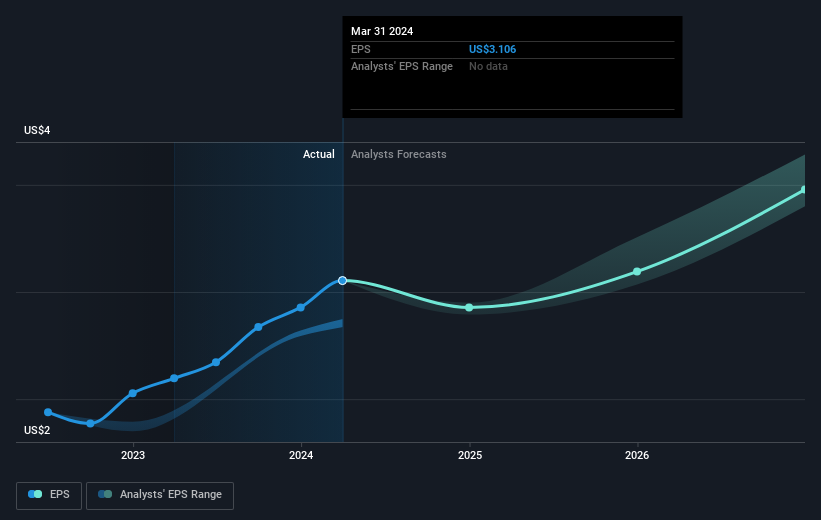
During five years of share price growth, Manhattan Associates achieved compound earnings per share (EPS) growth of 15% per year. This EPS growth is lower than the 28% average annual increase in the share price. So it's fair to assume the market has a higher opinion of the business than it did five years ago. And that's hardly shocking given the track record of growth. This optimism is visible in its fairly high P/E ratio of 77.06.
You can see how EPS has changed over time in the image below (click on the chart to see the exact values).
It is of course excellent to see how Manhattan Associates has grown profits over the years, but the future is more important for shareholders. If you are thinking of buying or selling Manhattan Associates stock, you should check out this FREE detailed report on its balance sheet.
A Different Perspective
Manhattan Associates' TSR for the year was broadly in line with the market average, at 26%. We should note here that the five-year TSR is more impressive, at 28% per year. Although the share price growth has slowed, the longer term story points to a business well worth watching. Most investors take the time to check the data on insider transactions. You can click here to see if insiders have been buying or selling.
We will like Manhattan Associates better if we see some big insider buys. While we wait, check out this free list of undervalued stocks (mostly small caps) with considerable, recent, insider buying.
Please note, the market returns quoted in this article reflect the market weighted average returns of stocks that currently trade on American exchanges.
Have feedback on this article? Concerned about the content? Get in touch with us directly. Alternatively, email editorial-team (at) simplywallst.com.
This article by Simply Wall St is general in nature. We provide commentary based on historical data and analyst forecasts only using an unbiased methodology and our articles are not intended to be financial advice. It does not constitute a recommendation to buy or sell any stock, and does not take account of your objectives, or your financial situation. We aim to bring you long-term focused analysis driven by fundamental data. Note that our analysis may not factor in the latest price-sensitive company announcements or qualitative material. Simply Wall St has no position in any stocks mentioned.
Have feedback on this article? Concerned about the content? Get in touch with us directly. Alternatively, email editorial-team@simplywallst.com
