
 Yahoo Finance
 Here's What's Concerning About Trade Desk's (NASDAQ:TTD) Returns On Capital
If you're not sure where to start when looking for the next multi-bagger, there are a few key trends you should keep an eye out for. Amongst other things, we'll want to see two things; firstly, a growing return on capital employed (ROCE) and secondly, an expansion in the company's amount of capital employed. If you see this, it typically means it's a company with a great business model and plenty of profitable reinvestment opportunities. Although, when we looked at Trade Desk (NASDAQ:TTD), it didn't seem to tick all of these boxes.
What Is Return On Capital Employed (ROCE)?
For those that aren't sure what ROCE is, it measures the amount of pre-tax profits a company can generate from the capital employed in its business. To calculate this metric for Trade Desk, this is the formula:
Return on Capital Employed = Earnings Before Interest and Tax (EBIT) ÷ (Total Assets - Current Liabilities)
0.11 = US$252m ÷ (US$4.7b - US$2.3b) (Based on the trailing twelve months to March 2024).
Therefore, Trade Desk has an ROCE of 11%. That's a pretty standard return and it's in line with the industry average of 11%.
View our latest analysis for Trade Desk
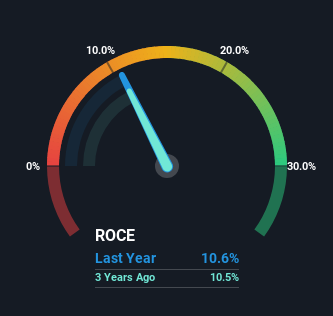
Above you can see how the current ROCE for Trade Desk compares to its prior returns on capital, but there's only so much you can tell from the past. If you're interested, you can view the analysts predictions in our free analyst report for Trade Desk .
What Does the ROCE Trend For Trade Desk Tell Us?
In terms of Trade Desk's historical ROCE movements, the trend isn't fantastic. Around five years ago the returns on capital were 21%, but since then they've fallen to 11%. Although, given both revenue and the amount of assets employed in the business have increased, it could suggest the company is investing in growth, and the extra capital has led to a short-term reduction in ROCE. If these investments prove successful, this can bode very well for long term stock performance.
On a separate but related note, it's important to know that Trade Desk has a current liabilities to total assets ratio of 49%, which we'd consider pretty high. This effectively means that suppliers (or short-term creditors) are funding a large portion of the business, so just be aware that this can introduce some elements of risk. Ideally we'd like to see this reduce as that would mean fewer obligations bearing risks.
The Key Takeaway
Even though returns on capital have fallen in the short term, we find it promising that revenue and capital employed have both increased for Trade Desk. And long term investors must be optimistic going forward because the stock has returned a huge 308% to shareholders in the last five years. So while the underlying trends could already be accounted for by investors, we still think this stock is worth looking into further.
Trade Desk could be trading at an attractive price in other respects, so you might find our free intrinsic value estimation for TTD on our platform quite valuable.
If you want to search for solid companies with great earnings, check out this free list of companies with good balance sheets and impressive returns on equity.
Have feedback on this article? Concerned about the content? Get in touch with us directly. Alternatively, email editorial-team (at) simplywallst.com.
This article by Simply Wall St is general in nature. We provide commentary based on historical data and analyst forecasts only using an unbiased methodology and our articles are not intended to be financial advice. It does not constitute a recommendation to buy or sell any stock, and does not take account of your objectives, or your financial situation. We aim to bring you long-term focused analysis driven by fundamental data. Note that our analysis may not factor in the latest price-sensitive company announcements or qualitative material. Simply Wall St has no position in any stocks mentioned.
Have feedback on this article? Concerned about the content? Get in touch with us directly. Alternatively, email editorial-team@simplywallst.com