Euronext Amsterdam Dividend Stocks To Consider In July 2024
As European markets experience a lift, with indices like the STOXX Europe 600 showing a positive trend, investors might find it opportune to consider dividend stocks on the Euronext Amsterdam. In light of recent economic data indicating moderated inflation and potential shifts in monetary policy, dividend-yielding stocks could offer a blend of stability and income in this evolving financial landscape.
Top 5 Dividend Stocks In The Netherlands
Name | Dividend Yield | Dividend Rating |
Acomo (ENXTAM:ACOMO) | 6.46% | ★★★★★☆ |
ABN AMRO Bank (ENXTAM:ABN) | 9.49% | ★★★★☆☆ |
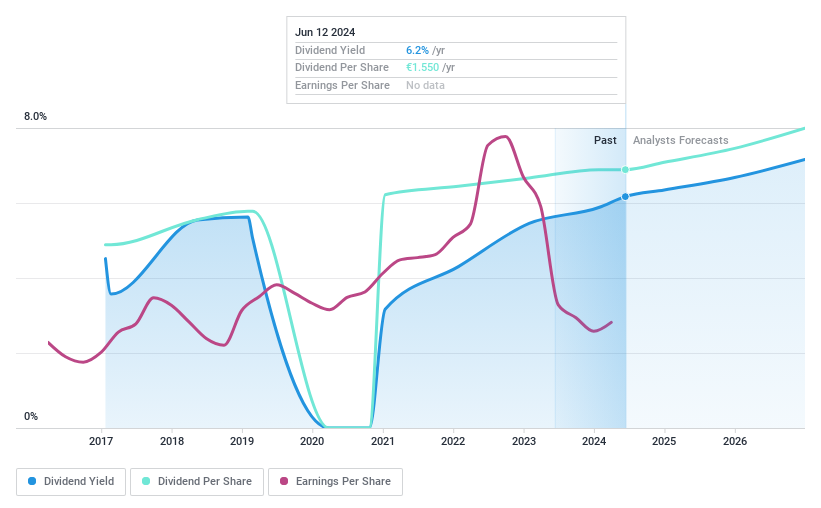
Signify (ENXTAM:LIGHT) | 6.22% | ★★★★☆☆ |
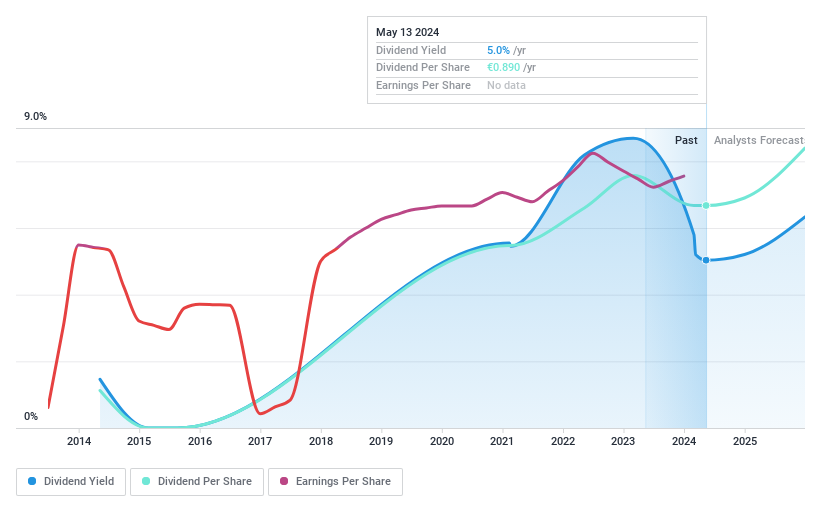
Randstad (ENXTAM:RAND) | 5.09% | ★★★★☆☆ |
Koninklijke KPN (ENXTAM:KPN) | 4.12% | ★★★★☆☆ |
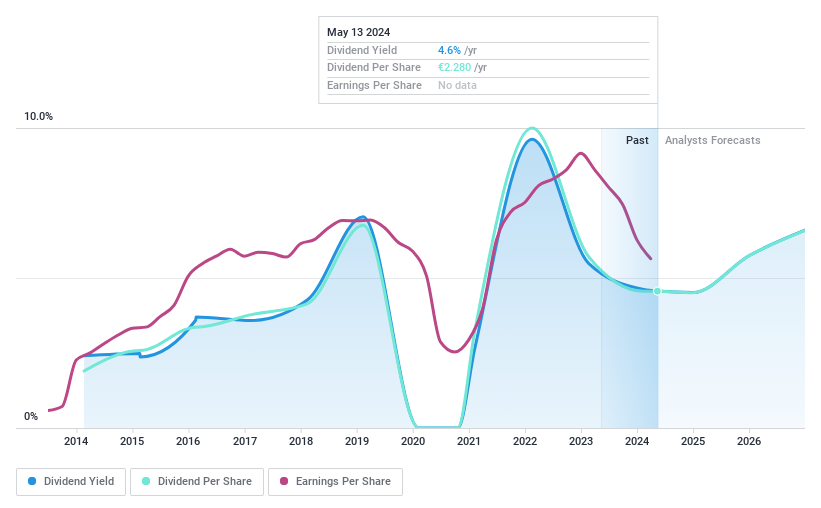
Koninklijke Heijmans (ENXTAM:HEIJM) | 3.65% | ★★★★☆☆ |
Underneath we present a selection of stocks filtered out by our screen.
Koninklijke Heijmans
Simply Wall St Dividend Rating: ★★★★☆☆
Overview: Koninklijke Heijmans N.V. operates in property development, construction, and infrastructure sectors primarily in the Netherlands, with a market capitalization of approximately €653.21 million.
Operations: Koninklijke Heijmans N.V. generates revenue from several key segments: Real Estate (€411.79 million), Van Wanrooij (€124.76 million), Infrastructure Works (€800.03 million), and Construction & Technology (€1.08 billion).
Dividend Yield: 3.7%
Koninklijke Heijmans exhibits a mixed performance as a dividend stock. Despite its lower dividend yield of 3.66% compared to the Dutch market average, its dividends are sustainably covered by both earnings and cash flows, with payout ratios of 37.1% and 59% respectively. However, the company has faced challenges with unstable dividend payments over the past decade and significant share price volatility recently. Its Price-To-Earnings ratio at 10.9x remains attractive below the market average of 16.6x.
Signify
Simply Wall St Dividend Rating: ★★★★☆☆
Overview: Signify N.V. operates globally, offering lighting products, systems, and services across Europe and the Americas, with a market capitalization of approximately €3.15 billion.
Operations: Signify N.V. generates revenue primarily from its conventional lighting segment, totaling €0.56 billion.
Dividend Yield: 6.2%
Signify's dividend profile shows potential with a 6.22% yield, ranking in the top quartile of Dutch dividend stocks. However, its dividend history is less robust, marked by volatility and a short track record of only seven years. Financially, Signify trades at 53.7% below its estimated fair value and maintains a sustainable payout with an earnings coverage ratio at 88.1% and cash flow coverage at 32.4%. Recent strategic moves include a partnership with Mercedes-AMG PETRONAS F1 Team and completing a share buyback program for €11.9 million to cover employee share plans, reflecting an ongoing commitment to shareholder returns despite some earnings instability due to one-off items.
Delve into the full analysis dividend report here for a deeper understanding of Signify.
Our valuation report here indicates Signify may be undervalued.
Randstad
Simply Wall St Dividend Rating: ★★★★☆☆
Overview: Randstad N.V. specializes in offering comprehensive work and human resources services, with a market capitalization of approximately €7.93 billion.
Operations: Randstad N.V. does not provide specific revenue segmentation details in the provided text.
Dividend Yield: 5.1%
Randstad's dividend sustainability is underpinned by a payout ratio of 73.4% and a cash payout ratio of 45.9%, indicating that dividends are well-covered by both earnings and cash flows. However, its dividend yield at 5.1% is slightly below the top Dutch payers. Despite a history of dividend volatility over the past decade, Randstad has managed to increase its dividends during this period. Recent financials show a decline in Q1 sales to €5.94 billion from €6.52 billion year-on-year, with net income also falling to €88 million from €154 million, impacting short-term earnings visibility despite ongoing share buybacks totaling €316.66 million for 3.41% of shares.
Turning Ideas Into Actions
Access the full spectrum of 6 Top Euronext Amsterdam Dividend Stocks by clicking on this link.
Already own these companies? Bring clarity to your investment decisions by linking up your portfolio with Simply Wall St, where you can monitor all the vital signs of your stocks effortlessly.
Enhance your investing ability with the Simply Wall St app and enjoy free access to essential market intelligence spanning every continent.
Curious About Other Options?
Explore high-performing small cap companies that haven't yet garnered significant analyst attention.
Fuel your portfolio with companies showing strong growth potential, backed by optimistic outlooks both from analysts and management.
Find companies with promising cash flow potential yet trading below their fair value.
This article by Simply Wall St is general in nature. We provide commentary based on historical data and analyst forecasts only using an unbiased methodology and our articles are not intended to be financial advice. It does not constitute a recommendation to buy or sell any stock, and does not take account of your objectives, or your financial situation. We aim to bring you long-term focused analysis driven by fundamental data. Note that our analysis may not factor in the latest price-sensitive company announcements or qualitative material. Simply Wall St has no position in any stocks mentioned.
Companies discussed in this article include ENXTAM:HEIJM ENXTAM:LIGHT and ENXTAM:RAND.
Have feedback on this article? Concerned about the content? Get in touch with us directly. Alternatively, email editorial-team@simplywallst.com