
 Yahoo Finance
 Estimating The Fair Value Of Chin Teck Plantations Berhad (KLSE:CHINTEK)
Key Insights
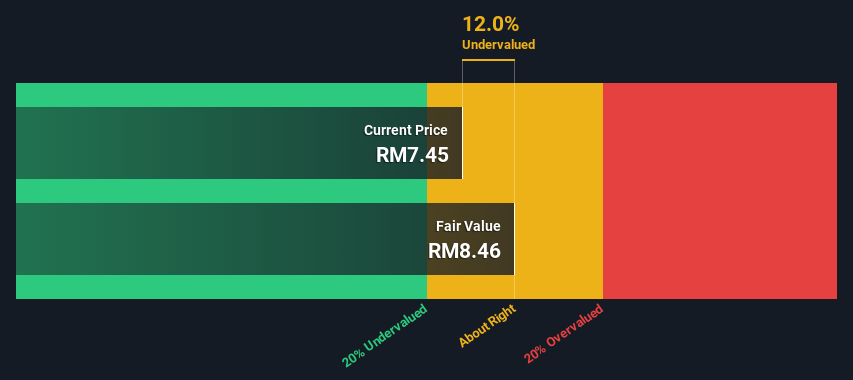
Chin Teck Plantations Berhad's estimated fair value is RM8.46 based on 2 Stage Free Cash Flow to Equity
Chin Teck Plantations Berhad's RM7.45 share price indicates it is trading at similar levels as its fair value estimate
The average premium for Chin Teck Plantations Berhad's competitorsis currently 79%
In this article we are going to estimate the intrinsic value of Chin Teck Plantations Berhad (KLSE:CHINTEK) by projecting its future cash flows and then discounting them to today's value. This will be done using the Discounted Cash Flow (DCF) model. Don't get put off by the jargon, the math behind it is actually quite straightforward.
Companies can be valued in a lot of ways, so we would point out that a DCF is not perfect for every situation. If you want to learn more about discounted cash flow, the rationale behind this calculation can be read in detail in the Simply Wall St analysis model.
Check out our latest analysis for Chin Teck Plantations Berhad
Crunching The Numbers
We are going to use a two-stage DCF model, which, as the name states, takes into account two stages of growth. The first stage is generally a higher growth period which levels off heading towards the terminal value, captured in the second 'steady growth' period. To begin with, we have to get estimates of the next ten years of cash flows. Seeing as no analyst estimates of free cash flow are available to us, we have extrapolate the previous free cash flow (FCF) from the company's last reported value. We assume companies with shrinking free cash flow will slow their rate of shrinkage, and that companies with growing free cash flow will see their growth rate slow, over this period. We do this to reflect that growth tends to slow more in the early years than it does in later years.
Generally we assume that a dollar today is more valuable than a dollar in the future, so we need to discount the sum of these future cash flows to arrive at a present value estimate:
10-year free cash flow (FCF) forecast
2024 | 2025 | 2026 | 2027 | 2028 | 2029 | 2030 | 2031 | 2032 | 2033 | |
Levered FCF (MYR, Millions) | RM45.9m | RM44.9m | RM44.7m | RM45.0m | RM45.7m | RM46.7m | RM47.9m | RM49.3m | RM50.8m | RM52.5m |
Growth Rate Estimate Source | Est @ -4.67% | Est @ -2.20% | Est @ -0.48% | Est @ 0.73% | Est @ 1.58% | Est @ 2.17% | Est @ 2.58% | Est @ 2.87% | Est @ 3.08% | Est @ 3.22% |
Present Value (MYR, Millions) Discounted @ 8.6% | RM42.3 | RM38.1 | RM34.9 | RM32.3 | RM30.2 | RM28.4 | RM26.9 | RM25.4 | RM24.1 | RM22.9 |
("Est" = FCF growth rate estimated by Simply Wall St)
Present Value of 10-year Cash Flow (PVCF) = RM306m
After calculating the present value of future cash flows in the initial 10-year period, we need to calculate the Terminal Value, which accounts for all future cash flows beyond the first stage. The Gordon Growth formula is used to calculate Terminal Value at a future annual growth rate equal to the 5-year average of the 10-year government bond yield of 3.6%. We discount the terminal cash flows to today's value at a cost of equity of 8.6%.
Terminal Value (TV)= FCF2033 × (1 + g) ÷ (r – g) = RM52m× (1 + 3.6%) ÷ (8.6%– 3.6%) = RM1.1b
Present Value of Terminal Value (PVTV)= TV / (1 + r)10= RM1.1b÷ ( 1 + 8.6%)10= RM468m
The total value is the sum of cash flows for the next ten years plus the discounted terminal value, which results in the Total Equity Value, which in this case is RM773m. To get the intrinsic value per share, we divide this by the total number of shares outstanding. Compared to the current share price of RM7.5, the company appears about fair value at a 12% discount to where the stock price trades currently. Remember though, that this is just an approximate valuation, and like any complex formula - garbage in, garbage out.
Important Assumptions
The calculation above is very dependent on two assumptions. The first is the discount rate and the other is the cash flows. Part of investing is coming up with your own evaluation of a company's future performance, so try the calculation yourself and check your own assumptions. The DCF also does not consider the possible cyclicality of an industry, or a company's future capital requirements, so it does not give a full picture of a company's potential performance. Given that we are looking at Chin Teck Plantations Berhad as potential shareholders, the cost of equity is used as the discount rate, rather than the cost of capital (or weighted average cost of capital, WACC) which accounts for debt. In this calculation we've used 8.6%, which is based on a levered beta of 0.800. Beta is a measure of a stock's volatility, compared to the market as a whole. We get our beta from the industry average beta of globally comparable companies, with an imposed limit between 0.8 and 2.0, which is a reasonable range for a stable business.
SWOT Analysis for Chin Teck Plantations Berhad
Strength
Currently debt free.
Dividends are covered by earnings and cash flows.
Weakness
Earnings declined over the past year.
Dividend is low compared to the top 25% of dividend payers in the Food market.
Opportunity
Annual earnings are forecast to grow for the next 3 years.
Good value based on P/E ratio and estimated fair value.
Threat
No apparent threats visible for CHINTEK.
Moving On:
Although the valuation of a company is important, it is only one of many factors that you need to assess for a company. The DCF model is not a perfect stock valuation tool. Preferably you'd apply different cases and assumptions and see how they would impact the company's valuation. For instance, if the terminal value growth rate is adjusted slightly, it can dramatically alter the overall result. For Chin Teck Plantations Berhad, we've compiled three further factors you should further examine:
Risks: Every company has them, and we've spotted 1 warning sign for Chin Teck Plantations Berhad you should know about.
Future Earnings: How does CHINTEK's growth rate compare to its peers and the wider market? Dig deeper into the analyst consensus number for the upcoming years by interacting with our free analyst growth expectation chart.
Other Solid Businesses: Low debt, high returns on equity and good past performance are fundamental to a strong business. Why not explore our interactive list of stocks with solid business fundamentals to see if there are other companies you may not have considered!
PS. Simply Wall St updates its DCF calculation for every Malaysian stock every day, so if you want to find the intrinsic value of any other stock just search here.
Have feedback on this article? Concerned about the content? Get in touch with us directly. Alternatively, email editorial-team (at) simplywallst.com.
This article by Simply Wall St is general in nature. We provide commentary based on historical data and analyst forecasts only using an unbiased methodology and our articles are not intended to be financial advice. It does not constitute a recommendation to buy or sell any stock, and does not take account of your objectives, or your financial situation. We aim to bring you long-term focused analysis driven by fundamental data. Note that our analysis may not factor in the latest price-sensitive company announcements or qualitative material. Simply Wall St has no position in any stocks mentioned.
Have feedback on this article? Concerned about the content? Get in touch with us directly. Alternatively, email editorial-team@simplywallst.com
