Singapore markets open in 10 minutes
Straits Times Index
3,293.13 +20.41 (+0.62%) S&P 500
5,071.63 +1.08 (+0.02%) Dow
38,460.92 -42.77 (-0.11%) Nasdaq
15,712.75 +16.11 (+0.10%) Bitcoin USD
64,613.81 -2,118.53 (-3.17%) CMC Crypto 200
1,394.70 -29.40 (-2.06%)
JPMorgan Multi Income (mth) - SGD Hdg (0P0000X4K6.SI)
SES - SES Delayed price. Currency in SGD
Add to watchlist
At close: 04:00AM SGT
JPMorgan Multi Income (mth) - SGD Hdg
8 Connaught Road Central
21st Floor, Chater House
(852) 22651133
Management information
,Lead manager since 3 May 2016
董事总经理,现任摩根资产管理多资产团队(Multi-Asset Solutions)的基金经理,驻于香港。 Leon 在Amundi Hong Kong Limited担任亚洲多元资产投资主管后加入团队。 在加入 Amundi 之前,Leon 曾在高盛私人财富管理、汇丰环球资产管理(香港)和安盛投资经理担任高级投资职务。 Leon 毕业于墨尔本的莫纳什大学,获得理学学士学位(计算机科学、会计和经济学),并于1997 年成为CFA持证人。
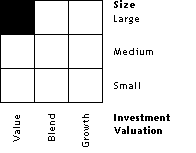
Morningstar style box
Yahoo partners with Morningstar, a leading market research and investment data group to help investors rate and compare funds on Yahoo Finance. The Morningstar Category is shown next to the Morningstar Style Box, which identifies a fund's investment focus, based on the underlying securities in the fund.

Morningstar category
While the investment objective stated in a fund's prospectus may or may not reflect how the fund actually invests, the Morningstar category is assigned based on the underlying securities in each portfolio. Morningstar categories help investors and investment professionals make meaningful comparisons between funds. The categories make it easier to build well-diversified portfolios, assess potential risk and identify top-performing funds. We place funds in a given category based on their portfolio statistics and compositions over the past three years. If the fund is new and has no portfolio history, we estimate where it will fall before giving it a more permanent category assignment. Where necessary, we may change a category assignment based on recent changes to the portfolio.
Fund overview
CategoryN/A
Fund familyJPMorgan Funds (Asia) Limited
Net assetsN/A
YTD return2.02%
Yield5.42%
Morningstar ratingN/A1
Inception date30 Apr 2019
Fund operations
Last dividend0.12
Last cap gainN/A
Holdings turnoverN/A
Average for categoryN/A
Fees and expenses
Expense0P0000X4K6.SICategory average
Annual report expense ratio (net)0.00%N/A
Prospectus net expense ratio0.00%N/A
Prospectus gross expense ratio0.00%N/A
Max 12b1 feeN/AN/A
Max front end sales loadN/AN/A
Max deferred sales loadN/AN/A
3-yr expense projection0N/A
5-yr expense projection0N/A
10-yr expense projection0N/A