
 Yahoo Finance
 The inverted yield curve sets the stage for a 'last gasp rally' in stocks
Now that the yield curve has inverted, what’s next for the stock market?
“The U.S. equity market (^GSPC) is on borrowed time after the yield curve inverts,” Bank of America Merrill Lynch’s Stephen Suttmeier wrote on Tuesday. “However, after an initial post-inversion dip, the S&P 500 can rally meaningfully prior to a bigger U.S. recession related drawdown.”
In other words, stocks tend to go down, then go way up, and then go way way down.
On Wednesday morning at about 6 a.m. ET, the 10-year Treasury yield (^TNX) dipped below the 2-year yield. U.S. stock market futures tumbled with Dow futures (YM=F) losing about 300 points in the minutes that followed.
And so if history is a guide, then now might be a time to buy.
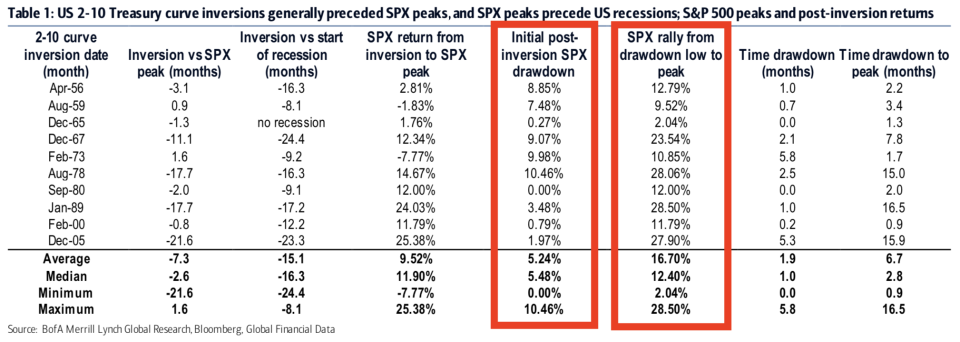
“The initial post-inversion drawdown is 5.2% on average (5.5% median) but has ranged from 0% (1980) to 10.5% (1978),” Suttmeier observed of the post-inversion market reactions. “These drawdowns typically last one to two months but have ranged from 0 (1980) to 5.8 months (1973).
“After the initial drawdown, the S&P 500 can have a meaningful last gasp rally,” he added. “This rally has averaged 16.7% (12.4% median) with a range of 2.0% (1965) to 28.5% (1989) and lasts 6.7 months on average (2.8 median) with a range of 0.9 to 16.5 months. The 1967, 1978, 1989, and 2005 inversions saw last gasp rallies in excess of 20% on the S&P 500.”
To be clear, these yield curve inversions and market swings aren’t occurring in a vacuum. In fact, the major concern is that yield curve inversions have a stellar track record of preceding economic recessions. And recessions are always bad news for stocks.
“S&P 500 corrections associated with NBER recessions average 31.7% (22.2% median) and tend to last 14-15 months (range of 1.4 to 33.0 months),” Suttmeier added.
All that said, Bank of America Merrill Lynch’s house view is that we are in the midst of a long-term secular bull market, and that any impending economic recession and market sell-off would just be a blip in much bigger bullish story.
“Recessions do occur during secular bull markets,” Suttmeier said. “The 1950-1966 bull market had three and the 1980-2000 bull market had two. The silver lining is that the S&P 500 pullbacks associated with recessions during secular bull trends are much less severe and averaged 20% (range of 13.9% to 27.1%) rather than the average 40% drawdown (range of 0.0% to 86.2%) for recession pullbacks during secular bear phases.”

—
Sam Ro is managing editor at Yahoo Finance. Follow him on Twitter: @SamRo
Read more:
UBS warns of a 'major surprise this year' that'll send stocks down 9%
How Charlie Munger pulled Warren Buffett away from 'cigar butt' investing
Warren Buffett decries accounting rule change that has made a mess of Berkshire's earnings
Read the latest financial and business news from Yahoo Finance
Follow Yahoo Finance on Twitter, Facebook, Instagram, Flipboard, SmartNews, LinkedIn, YouTube, and reddit.
