
 Yahoo Finance
 Xylem (XYL) Q1 Earnings Lag Estimates, Organic View Weak
Xylem Inc. XYL has reported weaker-than-expected results for first-quarter 2020. Its earnings in the quarter lagged estimates by 37.8%, while sales missed the same by 1.7%. Weak earnings results came in after three consecutive quarters of in-line results.
Adjusted earnings in the quarter under review were 23 cents per share, lagging the Zacks Consensus Estimate of 37 cents. Also, the bottom line decreased 55.8% from the year-ago figure of 52 cents.
It is worth noting that unfavorable movements in foreign currencies had an adverse impact of 2 cents per share on earnings.
Revenue Details
Xylem’s revenues of $1,123 million in the quarter under review moved down 9.2% from the year-ago quarter. Organic sales in the quarter declined 8%. The results bore the brunt of the coronavirus outbreak that lowered sales by 5%. Also, the company’s revenues lagged the Zacks Consensus Estimate of $1,143 million by 1.7%.
Geographically, organic sales fell 7% in the United States, 19% in emerging markets and 2% in Western Europe. Based on end-markets, organic sales in utilities fell 5%, while that in industrial declined 10%. Also, commercial and residential organic sales fell 11% and 14%, respectively.
Orders in the reported quarter fell 4% year over year to $1,261 million. Organically, orders declined 2%.
The company reports net sales under three segments, which are Water Infrastructure, Applied Water, and Measurement & Control Solutions.
The segmental information is briefly discussed below:
Revenues in the Water Infrastructure segment were $438 million, down 9.1% year over year. Organic sales in the quarter decreased 7% year over year. Results suffered from weakness in utilities and emerging markets. Business in China recorded a double-digit decline.
The Applied Water segment generated revenues of $338 million in the first quarter, down 10.8% year over year. Organic sales dipped 10% on a year-over-year basis. Business in commercial, residential and industrial markets was weak in the quarter. Geographically, businesses fell in the United States as well as declined in emerging markets and Western Europe.
Quarterly revenues of the Measurement & Control Solutions segment were $347 million, down 7.7% year over year. Organic sales decreased 7% year over year. Results suffered from weakness in water, test, energy and SaaS/other end markets. While businesses in the United States and emerging markets declined, it increased in Western Europe.
Margin Profile
In the quarter, the company’s cost of sales decreased 6.4% year over year to $714 million. As a percentage of revenues, it represented 63.6% versus 61.7% in the year-ago quarter. Gross profit decreased 13.7% year over year to $409 million, while margin dipped 190 basis points (bps) to 36.4%. Selling, general and administrative expenses dipped 2% to $297 million. Meanwhile, research and development expenses decreased 3.9% to $49 million.
Adjusted operating income in the quarter was $70 million, down 47.4% year over year. Operating margin was down 460 bps to 6.2%.
Balance Sheet and Cash Flow
Exiting the first quarter, Xylem had cash and cash equivalents of $739 million, up 2.1% from $724 million at the end of the last reported quarter. Long-term debt balance slipped 0.4% sequentially to $2,031 million.
In the quarter, the company used net cash of $2 million for its operating activities against cash flow generation of $83 million in the year-ago quarter. Capital expenditure was $51 million, down 26.1% from the year-ago figure of $69 million. Free cash outflow in the quarter was $53 million against the inflow of $14 million in the year-ago quarter.
Shareholder-Friendly Policies
In the quarter, the company paid out dividends amounting to $48 million, reflecting an increase of 9.1% from the year-ago quarter. Share repurchased in the quarter amounted to $60 million, up 53.8% year over year.
Outlook
In the quarters ahead, Xylem anticipates gaining from cost-reduction efforts (of about $100 million in 2020), solid liquidity and investments.
Due to the pandemic-related uncertainties, the company refrained from reinstating its projections for 2020. Notably, it withdrew its yearly forecast on Mar 31. However, it expects organic sales to decline 20-30% year over year in the second quarter.
Xylem Inc. Price, Consensus and EPS Surprise
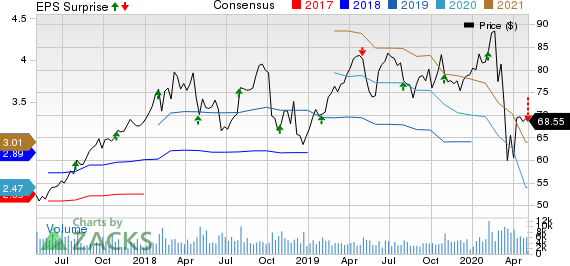
Xylem Inc. price-consensus-eps-surprise-chart | Xylem Inc. Quote
Zacks Rank & Stocks to Consider
The company currently has a market capitalization of $12.5 billion and a Zacks Rank #4 (Sell).
Some better-ranked stocks in the Zacks Industrial Products sector are Silgan Holdings Inc. SLGN, Superior Uniform Group, Inc. SGC and Graphic Packaging Holding Company GPK. While Silgan currently sports a Zacks Rank #1 (Strong Buy), both Superior Uniform and Graphic Packaging carry a Zacks Rank #2 (Buy). You can see the complete list of today’s Zacks #1 Rank stocks here.
In the past 30 days, earnings estimates for Silgan and Graphic Packaging improved for the current year, while have been unchanged for Superior Uniform. Further, earnings surprise for the last reported quarter was 16.33% for Silgan Holdings, 57.14% for Superior Uniform and 24% for Graphic Packaging.
Breakout Biotech Stocks with Triple-Digit Profit Potential
The biotech sector is projected to surge beyond $775 billion by 2024 as scientists develop treatments for thousands of diseases. They’re also finding ways to edit the human genome to literally erase our vulnerability to these diseases.
Zacks has just released Century of Biology: 7 Biotech Stocks to Buy Right Now to help investors profit from 7 stocks poised for outperformance. Our recent biotech recommendations have produced gains of +50%, +83% and +164% in as little as 2 months. The stocks in this report could perform even better.
See these 7 breakthrough stocks now>>
Want the latest recommendations from Zacks Investment Research? Today, you can download 7 Best Stocks for the Next 30 Days. Click to get this free report
Silgan Holdings Inc. (SLGN) : Free Stock Analysis Report
Graphic Packaging Holding Company (GPK) : Free Stock Analysis Report
Xylem Inc. (XYL) : Free Stock Analysis Report
Superior Uniform Group, Inc. (SGC) : Free Stock Analysis Report
To read this article on Zacks.com click here.
Zacks Investment Research
