
 Yahoo Finance
 Wynn Resorts (WYNN) Q3 Earnings Match Estimates, Revenues Top
Wynn Resorts, Limited WYNN reported decent third-quarter 2022 results, with earnings meeting the Zacks Consensus Estimate and revenues surpassing the same. The top line declined year over year, while the bottom line increased from the prior-year quarter's figure.
Craig Billings, CEO of Wynn Resorts, Limited, stated, "In Macau, while COVID-related travel restrictions continued to negatively impact our results, we were pleased to experience encouraging pockets of demand during the recent October holiday period. We remain confident that the market will benefit from the return of visitation over time."
Q3 Earnings & Revenues
During the quarter, the company reported an adjusted loss of $1.20 per share, in line with the Zacks Consensus Estimate. In the prior-year quarter, the company reported an adjusted loss of $1.24 per share.
Wynn Resorts, Limited Price, Consensus and EPS Surprise
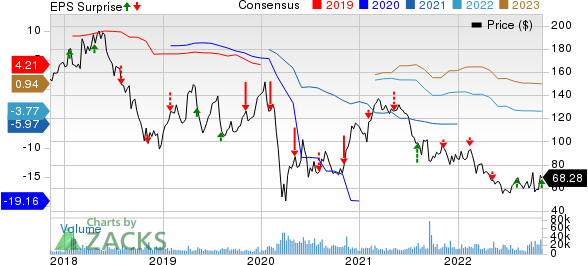
Wynn Resorts, Limited price-consensus-eps-surprise-chart | Wynn Resorts, Limited Quote
Quarterly revenues of $889.7 million surpassed the consensus mark of $852 million. However, the top line declined 10.5% on a year-over-year basis. The downside was mainly due to the dismal performance of Wynn Palace and Wynn Macau.
Wynn Palace Operations
During the third quarter, Wynn Palace revenues were $75.2 million compared with $181.3 million reported in the prior-year quarter. Casino revenues in the reported quarter totaled $45.4 million compared with $134.1 million reported in the prior-year quarter. Rooms and food and beverage revenues declined 55.4% and 47.7% year over year to $7 million and $5.7 million, respectively. During the quarter under review, entertainment, retail and other revenues declined 16.8% year over year to $17.2 million.
In the VIP segment, table games turnover was $283.7 million, down 77% year over year. VIP table games win (loss) rate (based on turnover) was 3.27%, within the expected range of 3.1-3.4%. The figure was below the 4.45% reported in the prior-year quarter. Table drop in the mass market segment was $197.1 million compared with $508.8 million reported in the prior-year quarter. Table games’ wins in mass market operations amounted to $42.4 million compared with $110.8 million reported in the prior-year quarter.
During the reported quarter, RevPAR declined 57.7% year over year to $41. Occupancy levels in the segment came in at 28.1% compared with 51.9% reported in the prior-year quarter. The average daily rate (ADR) during the quarter came in at $145, down 22.5% on a year-over-year basis.
Wynn Macau Operations
During the third quarter, Wynn Macau’s revenues amounted to $40.4 million compared with $130.7 million reported in the prior-year quarter. The downside was primarily due to a fall in the casino, rooms and entertainment, retail and other revenues.
Casino revenues in the reported quarter were $22.8 million, down 76.8% year over year. Rooms and entertainment, retail and other revenues declined 59.7% and 36% year over year to $4.4 million and $8.9 million, respectively. During the quarter, food and beverage revenues declined 44.1% year over year to $4.3 million.
Table games turnover in the VIP segment declined 88.6% year over year to $152.9 million. The VIP table games win rate (based on turnover) was 1.56%, below the expected range of 3.1-3.4%. Also, the figure was lower than 2.44% reported in the prior-year quarter.
Table drop in the mass market segment was $167.5 million compared with $441.9 million reported in the prior-year quarter. Table games win in the mass market category was $22.2 million compared with $87.1 million reported in the prior-year quarter.
During the reported quarter, RevPAR fell 60.2% year over year to $43. Occupancy levels in the segment came in at 31.4% compared with 51.3% in the prior-year quarter. However, ADR came in at $137, down 35.1% year over year.
Las Vegas Operations
During the third quarter, revenues from Las Vegas operations were $544.4 million compared with $476 million reported in the year-ago quarter.
Casino revenues increased 19.3% year over year to $134.3 million. Revenues from food and beverage, rooms and entertainment, retail and other increased 7.4%, 22.2% and 7.9% year over year to $193.7 million, $162.1 million and $54.2 million, respectively.
Table games drop increased 12.5% year over year to $570.4 million. Table games wins increased 7.3% year over year to $118.3 million. During the third quarter, table games win percentage of 20.7% was below the projected range of 22-26%. Also, the figure was below 21.7% reported in the prior-year quarter.
During the quarter under review, RevPAR increased 16% year over year to $378. The occupancy rate came in at 88.8%, up from 83% reported in the prior-year quarter. ADR was $426, up 8.7% year over year.
Encore Boston Harbor
During the third quarter, revenues from Encore Boston Harbor operations amounted to $211.8 million compared with $192.2 million reported in the prior-year quarter. During the quarter, table games win percentage of 21.1% was within the projected range of 18-22%. However, the figure was below 21.4% reported in the prior-year quarter.
During the reported quarter, RevPAR increased 25.3% year over year to $386. The occupancy rate came in at 97%, up from 87.8% reported in the prior-year quarter. ADR was $398, up 13.4% year over year.
Operating Performance
During the third quarter, adjusted property earnings before interests, taxes, depreciation and amortization (EBITDA) was $173.5 million compared with $154.6 million reported in the prior-year quarter.
In the quarter under review, adjusted property EBITDA from Wynn Macau totaled ($43.8) million compared with ($1.9) million reported in the prior-year quarter. Adjusted property EBITDA from Las Vegas operations was $195.8 million compared with $183.4 million reported in the year-ago quarter. Adjusted property EBITDA from Encore Boston Harbor was $61.1 million compared with $64.6 million reported in the prior-year quarter.
Cash Position
As of Sep 30, 2022, Wynn Resorts’ cash and cash equivalents totaled $1.94 billion compared with $2.01 billion as of Jun 30, 2022.
Total current and outstanding debt at the end of the third quarter amounted to $12.12 billion. The figure included $3.14 billion of Wynn Las Vegas-related debt, $6.18 billion of Macau debt, $2.19 billion of Wynn Resorts Finance debt and $613.3 million of debt held by the retail joint venture, which the company consolidated.
Zacks Rank & Key Picks
Wynn Resorts currently carries a Zacks Rank #3 (Hold). You can see the complete list of today’s Zacks #1 Rank (Strong Buy) stocks here.
Some better-ranked stocks in the Consumer Discretionary sector are Marriott International, Inc. MAR, Crocs, Inc. CROX and Boyd Gaming Corporation BYD.
Marriott currently carries a Zacks Rank #2 (Buy). MAR has a trailing four-quarter earnings surprise of 18.1%, on average. The stock has declined 4.6% in the past year.
The Zacks Consensus Estimate for MAR’s current financial year sales and EPS indicates a surge of 47% and 104.7%, respectively, from the year-ago period’s reported levels.
Crocs currently has a Zacks Rank #2. CROX has a long-term earnings growth rate of 15%. Shares of Crocs have plunged 53.9% in the past year.
The Zacks Consensus Estimate for CROX’s 2022 sales and EPS indicates a rise of 51.5% and 23.7%, respectively, from the year-ago period’s levels.
Boyd Gaming carries a Zacks Rank #2. BYD has a long-term earnings growth rate of 12.8%. The stock has declined 8.2% in the past year.
The Zacks Consensus Estimate for BYD’s 2022 sales and EPS indicates growth of 4.4% and 11.7%, respectively, from the year-ago period’s reported levels.
Want the latest recommendations from Zacks Investment Research? Today, you can download 7 Best Stocks for the Next 30 Days. Click to get this free report
Marriott International, Inc. (MAR) : Free Stock Analysis Report
Wynn Resorts, Limited (WYNN) : Free Stock Analysis Report
Boyd Gaming Corporation (BYD) : Free Stock Analysis Report
Crocs, Inc. (CROX) : Free Stock Analysis Report
To read this article on Zacks.com click here.
Zacks Investment Research
