
 Yahoo Finance
 Wynn Resorts (WYNN) Q2 Earnings Top, Revenues Miss Estimates

Wynn Resorts, Limited WYNN reported its second-quarter 2022 results, wherein earnings surpassed the Zacks Consensus Estimate but revenues missed the same. Moreover, the top line also declined year over year.
Craig Billings, CEO of Wynn Resorts, Limited, stated, “Our second quarter financial results reflect continued strength at both Wynn Las Vegas and Encore Boston Harbor. Our teams' ongoing focus on five-star hospitality and new experiences at our market-leading properties combined with very strong customer demand drove a new all-time quarterly record for Adjusted Property EBITDA at Wynn Las Vegas and a second quarter record at Encore Boston Harbor.”
Q2 Earnings & Revenues
The company reported an adjusted loss of 82 cents per share, narrower than the Zacks Consensus Estimate of a loss of 94 cents. In the prior-year quarter, the company reported an adjusted loss of $1.12 per share.
Revenues during the second quarter came in at $908.8 million, missing the Zacks Consensus Estimate of $1,009 million by 9.9%. In the prior-year quarter, the company had delivered revenues of $990.1 million. The company’s top line was hurt by dismal Wynn Palace performance.
Wynn Palace Operations
During the second quarter, Wynn Palace revenues were $58.7 million compared with $270.4 million reported in the prior-year quarter. Casino revenues in the reported quarter totaled $27.2 million compared with $212.1 million reported in the prior-year quarter. Rooms and food and beverage revenues declined 66.4% and 50.3% year over year to $7 million and $6.8 million, respectively. During the quarter under review, entertainment, retail and other revenues increased 25.5% year over year to $17.6 million.
In the VIP segment, table games turnover was $344.5 million, down 81% year over year. VIP table games win (loss) rate (based on turnover) was 1.94%, lower than the expected range of 3.1-3.4%. The figure was below the 3.95% reported in the prior-year quarter. Table drop at the mass market segment was $210.5 million compared with $707.5 million reported in the prior-year quarter. Table games’ wins in mass market operations amounted to $41.6 million compared with $163.5 million reported in the prior-year quarter.
During the reported quarter, RevPAR declined 67.7% year over year to $41. Occupancy levels in the segment came in at 28.5% compared with 70.6% reported in the prior-year quarter. The average daily rate (ADR) during the quarter came in at $145, down 19.4% on a year-over-year basis.
Wynn Macau Operations
During the second quarter, Wynn Macau’s revenues amounted to $58.6 million compared with $184 million reported in the prior-year quarter. The downside was primarily due to a fall in the casino, rooms and entertainment, retail and other revenues.
Casino revenues in the reported quarter were $40 million, down 71.9% year over year. Rooms and entertainment, retail and other revenues declined 64.5% and 56% year over year to $4.8 million and $8.6 million, respectively. During the quarter, food and beverage revenues decreased 38.9% year over year to $5.2 million.
Table games turnover in the VIP segment declined 79.8% year over year to $301.6 million. The VIP table games win rate (based on turnover) was 4.79%, above the expected range of 3.1-3.4%. The figure was higher than the 2.64% reported in the prior-year quarter.
Table drop in the mass market segment was $216.2 million compared with $670.4 million reported in the prior-year quarter. Table games win in the mass market category was $30.6 million compared with $128.9 million reported in the prior-year quarter.
During the reported quarter, RevPAR fell 65.2% year over year to $47. Occupancy levels in the segment came in at 31.3% compared with 68% in the prior-year quarter. However, ADR came in at $150, down 24.2% year over year.
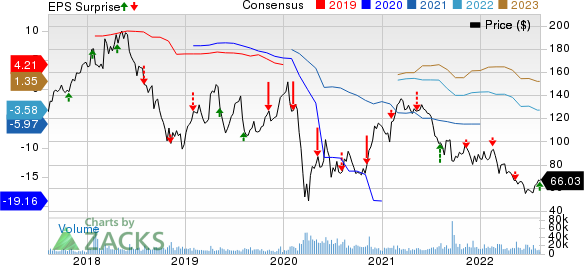
Wynn Resorts, Limited Price, Consensus and EPS Surprise
Wynn Resorts, Limited price-consensus-eps-surprise-chart | Wynn Resorts, Limited Quote
Las Vegas Operations
During the second quarter, revenues from Las Vegas operations were $561.1 million compared with $355.1 million reported in the year-ago quarter.
Casino revenues surged 20% year over year to $135.3 million. Revenues from food and beverage, rooms and entertainment, retail and other increased 74.2%, 78.2% and 73.9% year over year to $196.6 million, $167.1 million and $62 million, respectively.
Table games drop increased 32.3% year over year to $565 million. Table games’ wins surged 40.3% year over year to $138.9 million. During the second quarter, table games win percentage of 24.6% was within the projected range of 22-26% and in line with the prior-year quarter’s levels.
During the quarter under review, RevPAR soared 86.2% year over year to $417. The occupancy rate came in at 90.5%, up from 67.2% reported in the prior-year quarter. ADR was $460, up 38.1% year over year.
Encore Boston Harbor
During the second quarter, revenues from Encore Boston Harbor operations amounted to $210.1 million compared with $165.2 million reported in the prior-year quarter. During the quarter, table games win percentage of 21.9% was within the projected range of 18-22%. The figure was higher than the 21.2% reported in the prior-year quarter.
During the reported quarter, RevPAR increased 37.8% year over year to $368. The occupancy rate came in at 94.1%, up from 87.8% reported in the prior-year quarter. ADR was $391, up 28.6% year over year.
Operating Performance
During the second quarter, adjusted property earnings before interests, taxes, depreciation and amortization (EBITDA) was $179.2 million compared with $206.9 million reported in the prior-year quarter.
In the quarter under review, adjusted property EBITDA from Wynn Macau totaled ($40.4) million against $14.1 million reported in the prior-year quarter. Adjusted property EBITDA from Las Vegas operations was $226.7 million compared with $133.2 million reported in the year-ago quarter. Adjusted property EBITDA from Encore Boston Harbor was $63.7 million compared with $46.9 million reported in the prior-year quarter.
Cash Position
As of Jun 30, 2022, Wynn Resorts’ cash and cash equivalents totaled $2.01 billion compared with $2.32 billion as of Mar 31, 2022.
Total current and outstanding debt at the end of the second quarter amounted to $11.91 billion. The figure included $3.13 billion of Wynn Las Vegas-related debt, $5.97 billion of Macau debt, $2.2 billion of Wynn Resorts Finance debt, and $613.2 million of debt held by the retail joint venture, which the company consolidated.
Zacks Rank & Key Picks
Wynn Resorts currently carries a Zacks Rank #3 (Hold). You can see the complete list of today’s Zacks #1 Rank (Strong Buy) stocks here.
Some better-ranked stocks in the Consumer Discretionary sector are Hyatt Hotels Corporation H, Marriott International, Inc. MAR and Choice Hotels International, Inc. CHH.
Hyatt currently carries a Zacks Rank #2 (Buy). The stock has increased 17.3% in the past year.
The Zacks Consensus Estimate for H’s current financial year sales and EPS indicates growth of 78.1% and 93.9%, respectively, from the year-ago period’s reported levels.
Marriott currently carries a Zacks Rank #2. MAR has a trailing four-quarter earnings surprise of 1.4%, on average. The stock has increased 15.1% in the past year.
The Zacks Consensus Estimate for MAR’s current financial year sales and EPS indicates growth of 44.6% and 93.7%, respectively, from the year-ago period’s reported levels.
Choice Hotels carries a Zacks Rank #2, at present. CHH has a trailing four-quarter earnings surprise of 20.4%, on average. The stock has decreased 6% in the past year.
The Zacks Consensus Estimate for CHH’s current financial year sales and EPS indicates growth of 13.6% and 17.7%, respectively, from the year-ago period’s reported levels.
Want the latest recommendations from Zacks Investment Research? Today, you can download 7 Best Stocks for the Next 30 Days. Click to get this free report
Marriott International, Inc. (MAR) : Free Stock Analysis Report
Hyatt Hotels Corporation (H) : Free Stock Analysis Report
Wynn Resorts, Limited (WYNN) : Free Stock Analysis Report
Choice Hotels International, Inc. (CHH) : Free Stock Analysis Report
To read this article on Zacks.com click here.
Zacks Investment Research