
 Yahoo Finance
 WTI Crude Oil Surges Past $46 Opening Up Late July Highs Near $50
DailyFX.com -
To receive Tyler’s analysis directly via email, please SIGN UP HERE
Talking Points:
Crude Oil Technical Strategy: Breakout of Corrective Triangle Turns Focus towards $50 per barrel
Crude Oil Breaks Above 50 Day Moving Average
Intraday Crude Oil Gained Over 6% Rising Most in 2 Weeks
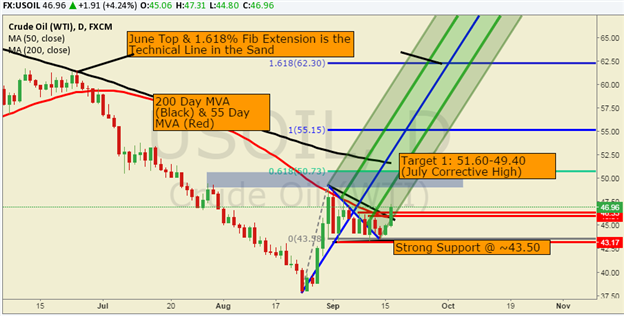
The second consecutive day of crude oil gains and the largest rise in 2 weeks was aided by a greater drop in US inventories than the market expected. After the DoE inventory print, price broke above the downward sloping 50-day moving average that has been resistance since late August.
The technical outlook for crude oil favors short-term upside due to a turn higher in oscillators after breaking above the sideways congestion pattern recently noted. The break above $46 a barrel turns short-term focus on August 31st resistance of $49.30/49 per barrel followed by the 100% Fib extension of the move up from the $37 low toward $55 a barrel and the 1.618% extension near the May high of $62 a barrel.
The short-term support over the first two weeks of September favors $43 a barrel as support and as long as price stays above this level, upside will be favored. Only a break below $43 would favor move back near annual lows and a continuation of the overall down trend.
Correlated Markets: Other highly correlated commodities like gold had a significant push higher today as well as inversely correlated markets likein USDCAD and USDEMFX like USDMXN and USDZAR saw a strong move lower further emphasizing the theme driving all these markets were in tandem. The longer term structure for commodities seems to favor a stronger bounce and oil could lead this surge. You could also look to a move higher in the S&P 500 to likely align with the move higher in oil as their correlation has recently strengthened.
Add these technical levels directly to your charts with our Support/Resistance Wizard app!
DailyFX provides forex news and technical analysis on the trends that influence the global currency markets.
Learn forex trading with a free practice account and trading charts from FXCM.
