
 Yahoo Finance
What’s the worst month for stocks? For Singapore, it starts today

August is over: Stock market investors in most markets can breathe a sigh of relief. If you’re in the U.K. or Singapore, though, you should buckle up. As shown in the chart below, over the past 20 years, August and September have delivered the worst average stock market performance for a number of markets. The worst monthly average return ranges from -1.0 percent for the S&P 500, to a lousy -2.5 percent decline (in August) for the MSCI Asia ex Japan index, which is a broad index of stock markets in Asia. The best performing month is a very different story. For Shanghai, April’s average return is 4.4 percent, well above the average monthly return of 0.8 percent. For the world as a whole, as measured by the MSCI World Index, April is also the best month, with an average monthly return of 2.4 percent.
Best & Worst Performance by Month
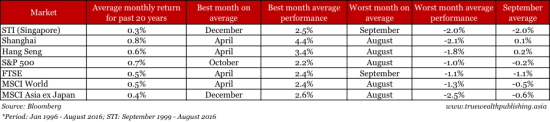
The good news for most markets is that August – on average the worst month for stocks in the markets we looked at, and for world stock markets overall (as reflected in the MSCI World index) – is over. Of course, there are some great Augusts for markets, and some terrible Aprils and Decembers (which have historically been the best months). And this year, August didn’t live up to its reputation. The MSCI World Index rose 0.4 percent, compared to its average August loss of 1.3 percent. And the MSCI Asia ex Japan index defied history as it rose 3.6 percent, much better than its historical average performance – and also far better than the best average monthly performance. Singapore and London beware – September is here If historical averages hold, investors in Singapore and London should brace themselves. September has historically been the worst month for both. Singapore’s STI has on average fallen 2.0 percent in September, compared to an average monthly gain of 0.3 percent. The FTSE has on average fallen 1.1 percent in September, compared to an average monthly gain of 0.5 percent over the past 20 years. Why are August and September across the board the worst months for stock markets? Part of the reason is that total trading volumes – that is, liquidity – in most markets is a lot lower during the (northern hemisphere’s) summer, when a lot of investors go on holiday. That means that a relatively small amount of selling can cause a disproportionately bigger decline in the market. And as more senior investment decision-makers are out of town during the holidays, there is – arguably – a greater likelihood that less buying activity will take place. But as with many strange patterns in markets – such as the January barometer, the Super Bowl indicator, sector rotation, and “sell in May and go away” – there isn’t a good explanation for why some months are better than others for stock markets. Just because there’s not a good reason for an investment phenomenon, though, doesn’t mean that investors can’t make money from it – or, as the case may be, brace themselves for losses.

Kim Iskyan
