This is why you should buy cheap markets – and these are the cheapest now

Buying the most expensive stock markets can be a recipe for disaster for your portfolio. Buying the cheapest markets is a far better idea, as I’ll show you. But what’s the best way to figure out which is which?
Figuring out cheap and expensive
First… whether a stock market is “cheap” or “expensive” depends on its valuation. One common approach to valuation is to look at the price-to-earnings (P/E) ratio. For an individual stock, computing the P/E ratio involves dividing a company’s share price by its earnings per share.
For example, a company whose shares trade at $100 and that earns $5 per share has a P/E ratio of 20. In a sense, that means that you’d be “paid back” for your investment in 20 years.
So if the share price of a stock goes up while its earnings stay the same, the P/E ratio goes up… and if the earnings go up but the share price stays the same, the P/E ratio goes down. A lower P/E ratio means a stock is cheaper.
For an entire stock market, calculating the P/E ratio involves finding the weighted average P/E of all the stocks that make up a stock market index. So a large company’s P/E ratio is going to count for more in the overall market’s valuation than a small company’s P/E ratio because it has a bigger weighting in the index.
There are a lot of ways to value a stock, or a stock market, besides the P/E ratio. You can also compare the share price of a company to its book value (the value of a company’s assets minus the value of its liabilities) per share. This is called the price-to-book value ratio (P/BV).
One of the problems with measures like P/E and P/BV is that they’re just a snapshot. Factors like the economic cycle can affect company, market and earnings in any given year. A big company, with a heavy weighting in the market, might have a bad year, throwing off the whole market’s P/E ratio. The weather could hurt some companies’ earnings, and pull down the earnings of the market as a whole. The commodities cycle can have a large effect on commodity companies…and on it goes. So, the P/E ratio is helpful – but it can be deceptive, too.
A better way than using just the P/E ratio is to adjust earnings for these kinds of cycles. One way to do this is to take the average for ten years of earnings (rather than just one year, like with the P/E ratio), and adjust them for inflation, to calculate the cyclically adjusted P/E ratio (CAPE). This smoothens the cyclicality of a single year P/E. It’s more difficult to calculate, but it’s a more complete valuation measure than the normal P/E ratio.
How cheap beats expensive
Investing in markets that have a low CAPE, on average, results in much better returns than buying stock markets with high CAPEs. Of course, this is the same for stocks… all else being equal (and it rarely is, but anyway), your odds of making money improve when you buy a stock that’s cheap, rather than a stock that’s expensive.
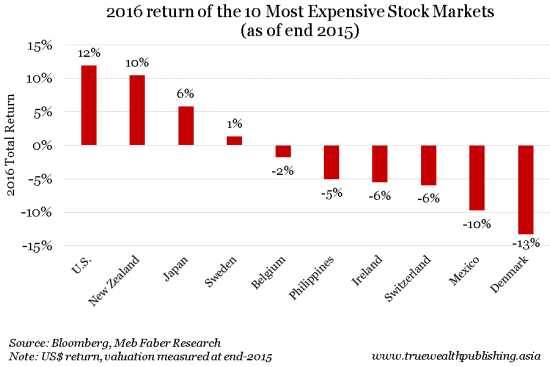
Stock market returns for 2016 illustrate this. The graph below shows the returns in U.S. dollars for the 10 stock markets that were the cheapest on CAPE basis as of the end of 2015.

Source: Truewealth Publishing Asia
As the graphs shows below, the cheapest markets posted an average return of 19 percent over the year – ranging from a 69 percent return for Brazil, to a 22 percent decline in Egypt’s stock market. By comparison, the most expensive markets recorded an average return of negative one percent (the U.S. performed the best, up 12 percent, and Denmark, the world’s most expensive market, was the worst, falling 13 percent).

Source: Truewealth Publishing Asia

Source: Truewealth Publishing Asia
The cheapest markets now
Right now, the world’s cheapest emerging markets on a CAPE basis are Russia, Hong Kong’s H-share market, and the Czech Republic. The cheapest developed markets are Portugal, Singapore and Spain. (We’ve written about Hong Kong’s H-share market, here.)

Source: Truewealth Publishing Asia
But just because a market is cheap (low CAPE) doesn’t mean that it won’t stay cheap, or get even cheaper, or perform well. At the end of 2015, for example, Singapore was one of the world’s cheapest markets, but the STI returned a lousy 2 percent in 2016. Similarly, just because a market is expensive (high CAPE), it doesn’t mean it won’t get more expensive, or that shares won’t appreciate. For example, the U.S. market had the fourth-highest CAPE at the end of 2015, but the U.S. market nevertheless posted a very solid return in 2016.
Valuation is just one of many factors that investors consider when buying shares, or a market. But it’s a good place to start.
ETFs for the Russian market are traded under the symbol RSX in New York, 3027 in Hong Kong, and RUS in Singapore. (Note that ETFs don’t necessarily directly replicate the index.) And for an approach to earning market-smashing returns in another cheap market, please click here to learn more about our “Project H” research.
Visit Truewealth Publishing Asia's website at truewealthpublishing.asia.
(By Kim Iskyan)
Related Articles
- 2017 Outlook for Developed Markets
- 2017 market outlook on emerging markets
- Top Asset Class to Invest in 2017

 Yahoo Finance
