
 Yahoo Finance
 Why Arcontech Group Plc’s (LON:ARC) ROE Of 15.11% Does Not Tell The Whole Story

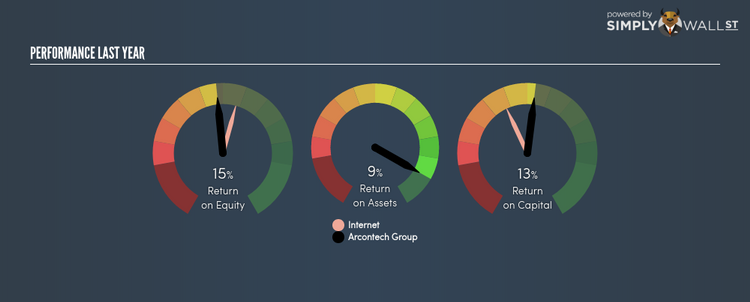
Arcontech Group Plc’s (AIM:ARC) most recent return on equity was a substandard 15.11% relative to its industry performance of 18.45% over the past year. ARC’s results could indicate a relatively inefficient operation to its peers, and while this may be the case, it is important to understand what ROE is made up of and how it should be interpreted. Knowing these components could change your view on ARC’s performance. Today I will look at how components such as financial leverage can influence ROE which may impact the sustainability of ARC’s returns. View our latest analysis for Arcontech Group
Breaking down Return on Equity
Firstly, Return on Equity, or ROE, is simply the percentage of last years’ earning against the book value of shareholders’ equity. An ROE of 15.11% implies £0.15 returned on every £1 invested. While a higher ROE is preferred in most cases, there are several other factors we should consider before drawing any conclusions.
Return on Equity = Net Profit ÷ Shareholders Equity
Returns are usually compared to costs to measure the efficiency of capital. Arcontech Group’s cost of equity is 6.19%. While Arcontech Group’s peers may have higher ROE, it may also incur higher cost of equity. An undesirable and unsustainable practice would be if returns exceeded cost. However, this is not the case for Arcontech Group which is encouraging. ROE can be dissected into three distinct ratios: net profit margin, asset turnover, and financial leverage. This is called the Dupont Formula:
Dupont Formula
ROE = profit margin × asset turnover × financial leverage
ROE = (annual net profit ÷ sales) × (sales ÷ assets) × (assets ÷ shareholders’ equity)
ROE = annual net profit ÷ shareholders’ equity
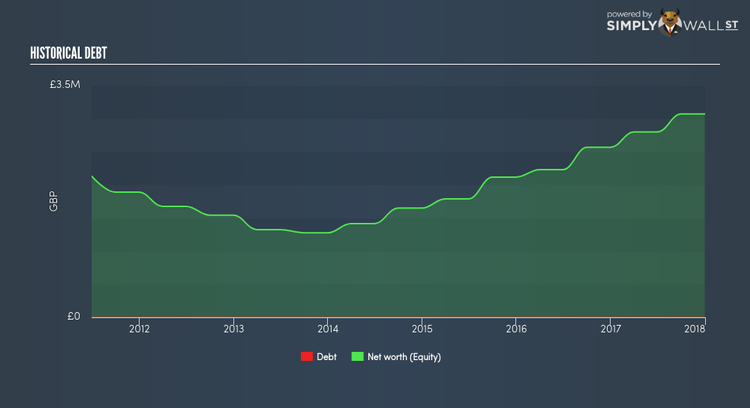
The first component is profit margin, which measures how much of sales is retained after the company pays for all its expenses. Asset turnover shows how much revenue Arcontech Group can generate with its current asset base. The most interesting ratio, and reflective of sustainability of its ROE, is financial leverage. Since ROE can be artificially increased through excessive borrowing, we should check Arcontech Group’s historic debt-to-equity ratio. Currently, Arcontech Group has no debt which means its returns are driven purely by equity capital. This could explain why Arcontech Group’s’ ROE is lower than its industry peers, most of which may have some degree of debt in its business.
Next Steps:
While ROE is a relatively simple calculation, it can be broken down into different ratios, each telling a different story about the strengths and weaknesses of a company. Even though Arcontech Group returned below the industry average, its ROE comes in excess of its cost of equity. Also, ROE is not likely to be inflated by excessive debt funding, giving shareholders more conviction in the sustainability of returns, which has headroom to increase further. ROE is a helpful signal, but it is definitely not sufficient on its own to make an investment decision.
For Arcontech Group, I’ve put together three important aspects you should look at:
Financial Health: Does it have a healthy balance sheet? Take a look at our free balance sheet analysis with six simple checks on key factors like leverage and risk.
Valuation: What is Arcontech Group worth today? Is the stock undervalued, even when its growth outlook is factored into its intrinsic value? The intrinsic value infographic in our free research report helps visualize whether Arcontech Group is currently mispriced by the market.
Other High-Growth Alternatives : Are there other high-growth stocks you could be holding instead of Arcontech Group? Explore our interactive list of stocks with large growth potential to get an idea of what else is out there you may be missing!
To help readers see pass the short term volatility of the financial market, we aim to bring you a long-term focused research analysis purely driven by fundamental data. Note that our analysis does not factor in the latest price sensitive company announcements.
The author is an independent contributor and at the time of publication had no position in the stocks mentioned.
