
 Yahoo Finance
 Where NCI Building Systems Inc (NYSE:NCS) Stands In Terms Of Earnings Growth Against Its Industry

After looking at NCI Building Systems Inc’s (NYSE:NCS) latest earnings announcement (28 January 2018), I found it useful to revisit the company’s performance in the past couple of years and assess this against the most recent figures. As a long term investor, I pay close attention to earnings trend, rather than the figures published at one point in time. I also compare against an industry benchmark to check whether NCI Building Systems’s performance has been impacted by industry movements. In this article I briefly touch on my key findings. Check out our latest analysis for NCI Building Systems
Did NCS beat its long-term earnings growth trend and its industry?
I like to use the ‘latest twelve-month’ data, which annualizes the most recent half-year data, or in some cases, the latest annual report is already the most recent financial year data. This blend enables me to analyze different stocks on a more comparable basis, using the most relevant data points. For NCI Building Systems, its most recent earnings (trailing twelve month) is US$57.58M, which, relative to the previous year’s level, has climbed up by 22.83%. Given that these values are fairly nearsighted, I’ve computed an annualized five-year figure for NCI Building Systems’s net income, which stands at -US$382.41K This suggests that, generally, NCI Building Systems has been able to increasingly raise its profits over the past couple of years as well.
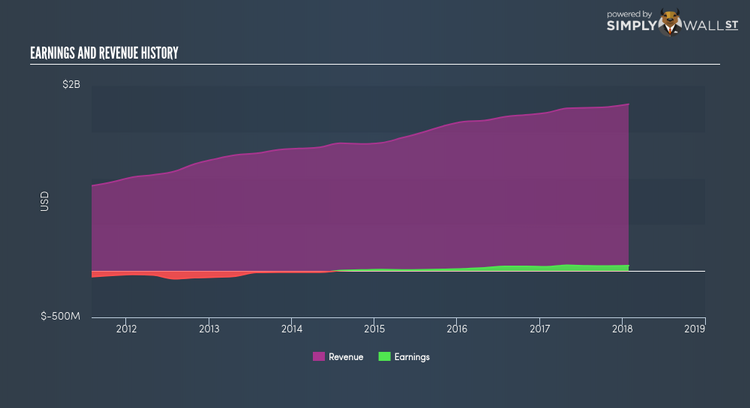
What’s enabled this growth? Let’s see if it is merely a result of industry tailwinds, or if NCI Building Systems has seen some company-specific growth. Over the past couple of years, NCI Building Systems increased its bottom line faster than revenue by efficiently controlling its costs. This brought about a margin expansion and profitability over time. Eyeballing growth from a sector-level, the US building industry has been growing its average earnings by double-digit 16.07% over the previous year, and 15.68% over the last five years. This means that any uplift the industry is enjoying, NCI Building Systems is capable of leveraging this to its advantage.
What does this mean?
Though NCI Building Systems’s past data is helpful, it is only one aspect of my investment thesis. While NCI Building Systems has a good historical track record with positive growth and profitability, there’s no certainty that this will extrapolate into the future. You should continue to research NCI Building Systems to get a more holistic view of the stock by looking at:
Future Outlook: What are well-informed industry analysts predicting for NCS’s future growth? Take a look at our free research report of analyst consensus for NCS’s outlook.
Financial Health: Is NCS’s operations financially sustainable? Balance sheets can be hard to analyze, which is why we’ve done it for you. Check out our financial health checks here.
Other High-Performing Stocks: Are there other stocks that provide better prospects with proven track records? Explore our free list of these great stocks here.
NB: Figures in this article are calculated using data from the trailing twelve months from 28 January 2018. This may not be consistent with full year annual report figures.
To help readers see pass the short term volatility of the financial market, we aim to bring you a long-term focused research analysis purely driven by fundamental data. Note that our analysis does not factor in the latest price sensitive company announcements.
The author is an independent contributor and at the time of publication had no position in the stocks mentioned.
