
 Yahoo Finance
 Want To Invest In BBR Holdings (S) Ltd (SGX:KJ5)? Here’s How It Performed Lately

In this article, I will take a look at BBR Holdings (S) Ltd’s (SGX:KJ5) most recent earnings update (31 March 2018) and compare these latest figures against its performance over the past few years, along with how the rest of KJ5’s industry performed. As a long-term investor, I find it useful to analyze the company’s trend over time in order to estimate whether or not the company is able to meet its goals, and eventually grow sustainably over time. See our latest analysis for BBR Holdings (S)
Did KJ5 perform worse than its track record and industry?
For the most up-to-date info, I use data from the most recent 12 months, which either annualizes the most recent 6-month earnings update, or in some cases, the most recent annual report is already the latest available financial data. This enables me to assess many different companies on a similar basis, using the most relevant data points. For BBR Holdings (S), its most recent trailing-twelve-month earnings is S$640.00K, which compared to the prior year’s level, has declined by a large -91.65%. Given that these values may be fairly short-term, I have created an annualized five-year figure for BBR Holdings (S)’s earnings, which stands at S$11.01M This doesn’t look much better, as earnings seem to have steadily been deteriorating over time.
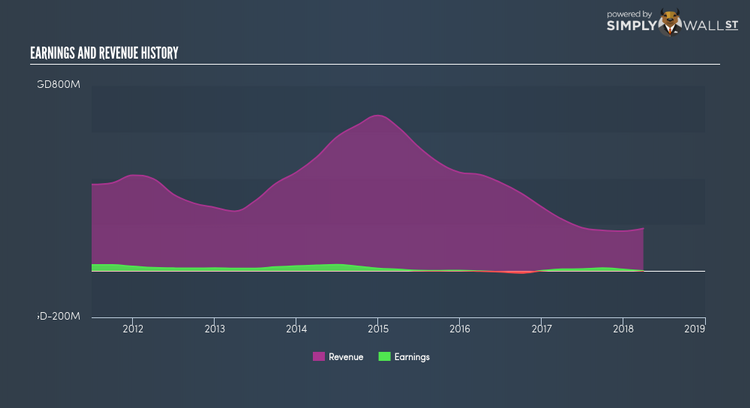
What could be happening here? Well, let’s take a look at what’s going on with margins and if the rest of the industry is facing the same headwind. Although revenue growth over the last couple of years, has been negative, earnings growth has been deteriorating by even more, suggesting that BBR Holdings (S) has been growing its expenses. This hurts margins and earnings, and is not a sustainable practice. Looking at growth from a sector-level, the SG construction industry has been enduring some headwinds over the previous couple of years, leading to an average earnings drop of -21.50% in the most recent year. This means that whatever headwind the industry is enduring, it’s hitting BBR Holdings (S) harder than its peers.
What does this mean?
BBR Holdings (S)’s track record can be a valuable insight into its earnings performance, but it certainly doesn’t tell the whole story. Generally companies that face a drawn out period of reduction in earnings are going through some sort of reinvestment phase Although, if the entire industry is struggling to grow over time, it may be a signal of a structural shift, which makes BBR Holdings (S) and its peers a riskier investment. You should continue to research BBR Holdings (S) to get a more holistic view of the stock by looking at:
Financial Health: Is KJ5’s operations financially sustainable? Balance sheets can be hard to analyze, which is why we’ve done it for you. Check out our financial health checks here.
Other High-Performing Stocks: Are there other stocks that provide better prospects with proven track records? Explore our free list of these great stocks here.
NB: Figures in this article are calculated using data from the trailing twelve months from 31 March 2018. This may not be consistent with full year annual report figures.
To help readers see pass the short term volatility of the financial market, we aim to bring you a long-term focused research analysis purely driven by fundamental data. Note that our analysis does not factor in the latest price sensitive company announcements.
The author is an independent contributor and at the time of publication had no position in the stocks mentioned.
