
 Yahoo Finance
 Volatility Readings Signaling Systemic Changes for Stock, Gold, FX?
Volatility is used by many as a measure of ‘fear’. Indicators like the CBOE’s VIX Volatility Index are created by using the implied volatility backed out of options based on the underlying market. This measures investors are pricing in as the expected level of activity for the foreseeable future (most popular volatility indexes have a 30 day outlook). And for those that are watching these indicators, there is a concerning rumble that has not yet shown through price action itself.
It should come as little surprise that the fireworks in markets this past Monday and Friday generated significant jumps from the various markets’ volatility measures. However, where price action has settled for most, we have seen concern through the derivative indicators hold suspiciously elevated.
The VIX – When to be a Contrarian

In the above chart, we are presented with a chart of the S&P 500 and the inverse of the VIX index. The volatility measure is flipped upside down because as fear declines, we naturally expect a risk-sensitive asset like equities to advance. The inverse correlation is quite strong as we can see in the chart. However, there is inevitably a point where conditions are ‘too quiet’ – just as we judge that a market has moved too high.
Fundamentally speaking, we can say equities (and other risky assets) have pushed forward without strong rates of return or strong assumptions of growth moving forward thanks to the efforts made by the Federal Reserve (Fed) and other global central banks. Their effort to absorb risk onto their balance sheets encourages traders to take on positions that they would otherwise deem too risky for the level of return. In the chart below, we can see just how divergent the potential for return is. The ‘Market Yield’ referred to in the chart is an aggregate of the benchmark 10-year Treasury rates for the major currency countries.
Take this quiz to assess your trading IQ!

This is an uneasy balance. Extreme low levels of return would normally keep investors out of the market, but the external support encourages those market participants to double down on risk on the assumption that there is little to no risk as long as a central bank is there to support them. Of course, the Fed is not an omnipotent buyer that can single-handled keep the markets on their bullish trajectory. There is a point of saturation where confidence in central bank-derived stability (or the effort to trade in front of the heavy-handed policy group) falters. We may be closer to that point than many appreciate.
It is treacherous to try and call a top on risk markets as we have seen through recent years as temporary setbacks have repeatedly proven themselves mere corrections in a larger bull trend. Nevertheless, the fundamentals and limitations of central banks are catching up. And, volatility measures are useful, first-level gauges of this risk.
In the first chart above, we see that the VIX marked a peak Monday that was significantly lower than those seen in February or December and June of last year. However, unlike the most recent two spikes, the buoyancy has proven more persistent. Turning from a five-year low, the VIX will eventually succumb to another bout of meaningful volatility that looks more like the June 2012 or August 2011. And, the catalyst may be price action itself.
The VIX is Directionally Challenged
One of the primary uses of options for many is as an insurance contract on investors underlying position. For a long-biased market like the S&P 500, that means the protection is more heavily bought when the market’s are dropping or at risk of doing so. It makes sense that if we are moving to new record highs (as the S&P 500 has) that insurance would be a better idea; but the extra cost in a world of extremely low rates of return leads many to forego the protection. This is complacency that contrarians look to exploit.
The fastest way to see the demand for insurance revived is to thereby threaten a significant move lower from the markets themselves – after the fact demand for safety. It is that twilight where the market’s start to stumble and investors recognize just how exposed they are that we see panic start to creep in. In looking for a spark to potentially start the markets moving down the path, I am particularly partial to the S&P 500’s recent retreat from record highs and duly formed range support now falling around 1,545.

Charting Created by John Kicklighter usingMarketscope 2.0
Appetite for Insurance Rising?
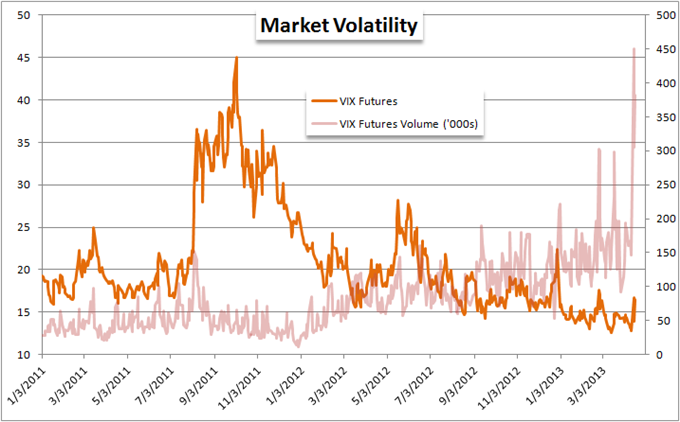
As we wait to see the definitive shift in capital markets and the volatility indexes that support them, we are already starting to see demand for insurance starting to perk up. In the chart below, we have VIX futures prices along with the daily volume for the instrument. Futures are a removed hedge with a time element and thereby are sometimes purchased ahead of the options themselves and outright short positions on the underlying market. Interest has surged to record highs this week to the point that the top three volume days in the history of the product was set Monday, Tuesday and Wednesday of this week.
Another measure to keep an eye on is the VXX – the Short-Term VIX ETN. More sensitive to near-term changes in volatility (fear), we have seen this index start to generate considerable interest. While a relatively young instrument (just over four years of historical price action), the incredible increase in volume suggests this is a new outlet to a hedge to detrimental market movements away from the traditional assets like options and VIX futures.

Forex Volatility Trending Higher Ahead of the Crowd
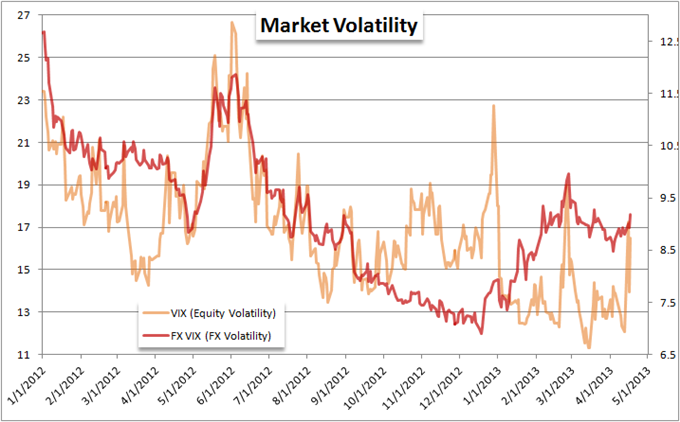
Equities aren’t the only market that we can pull volatility measures from. The Forex market is another asset where such measures of fear are very useful. In fact, given their level of liquidity and global stature; a fear gauge for currencies can give us greater scope. In the chart below, we compare the S&P 500-based VIX Index with an FX VIX which is created by taking an index of implied volatility from EURUSD, GBPUSD, USDJPY and AUDUSD. The correlation between the two is good, but there is a notable divergence – the FX volatility index is more deliberate and has held elevated through that consistency.
Given the market’s breadth and its ability to better reflect the destabilizing aspects that stimulus can cause to the normal flow of capital, there is an argument to be made that the FX VIX is a leading indicator to the rest of the asset classes in the market.
A Record Breaking Surge in Gold Volatility
And of course, a special mention must be made of the CBOE’s Gold Volatility Index. With the metal suffering a record-breaking drop Monday – remarkable as this is an asset that should do well as stimulus expectations rise – it comes as no surprise that its fear gauge put in for a record jump of its own. What is remarkable is that the volatility measure has been so slow to ease (showing protection demand remains very high) and that spot gold prices have not recovered in the moderating effort.

Be Prepared to Trade
Overall, these volatility measures can offer early warning to a bearish turn in investor sentiment, deleveraging from risky assets and even outright panic. Yet, swells in these indexes are not instant confirmation of the worst. We need to see the actual mechanics of a mass unwinding of risk before we can expect a lasting trend change.
However, when that sentiment shift does occur; the opportunities will be extensive. Equities are particularly overbought thanks to the central bank-led effort to promote leverage and exposure to the riskiest of assets. In the FX market, we will see the investment (Australia dollar, New Zealand dollar, Canadian dollar) and fundamentally-troubled currencies (Euro) suffer the most while safe havens (US Dollar and Japanese yen) reap the reward. Be prepared, but don’t settle in for the long-term trend until the markets commit.
--- Written by: John Kicklighter, Chief Strategist for DailyFX.com
Follow me on twitter at http://www.twitter.com/JohnKicklighter
Take this quiz to assess your trading IQ! (Initial login required)
Sign up for John’s email distribution list, here.
DailyFX provides forex news and technical analysis on the trends that influence the global currency markets.
Learn forex trading with a free practice account and trading charts from FXCM.
