
 Yahoo Finance
 Vail Resorts (MTN) Q3 Earnings Beat Estimates, Fall Y/Y
Vail Resorts, Inc. MTN reported third-quarter fiscal 2020 results, wherein both the top and the bottom line beat the Zacks Consensus Estimate. Following the results, the company’s shares moved up 5.3% during after-hours trading session on May 5.
In the quarter under review, the company reported earnings of $3.74 per share that beat the Zacks Consensus Estimate of $2.67. However, the metric declined 47.5% from year-ago earnings of $7.12.
Quarterly revenues came in at $694.1 million, beating the consensus mark of $613 million. However, the metric fell 27.5% on a year-over-year basis. The downside can be attributed to dismal performance by the Mountain segment and Lodging segments.
Vail Resorts, Inc. Price, Consensus and EPS Surprise
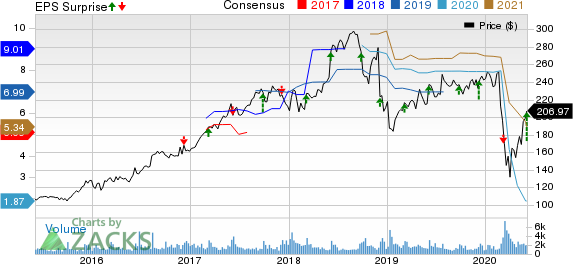
Vail Resorts, Inc. price-consensus-eps-surprise-chart | Vail Resorts, Inc. Quote
Segment Results
Vail Resorts generates revenues from two segments — Resort (99.9% to net revenues in third-quarter fiscal 2020) and Real Estate (0.1%). Under the Resort segment, the company has Mountain and Lodging services, and other (contributing 84% to net revenues in fiscal third quarter) as well as Mountain and Lodging retail and dining (16%).
Meanwhile, Vail Resorts has two reporting segments — Mountain and Lodging.
The Mountain segment reported revenues of $635.3 million in the quarter under review, down 27.6% year over year due to lower visitation associated with the closure of its North American destination mountain resorts and regional ski areas because of the COVID-19 outbreak, partially offset by incremental revenues from Peak Resorts, Inc.
The segment’s EBITDA amounted to $301.4 million, down 35.6% from $468.1 million in the prior-year quarter. However, operating expenses at the Mountain segment totaled $333.8 million, down 18.6% year over year.
Lodging net revenues in the reported quarter were $58.4 million, down 26.9% year over year primarily due to the closure of North American lodging properties as a result of the pandemic. Under the segment, EBITDA declined 76.8% to $2.9 million from the prior-year quarter.
However, operating expenses at the Lodging segment contracted 17.5% year over year to $55.5 million.
Operating Results
Vail Resorts reported EBITDA of $304.4 million in the quarter under review compared with $480.7 million in the prior-year quarter. The decline of $176.4 million (36.7%) includes impacts from the deferral of $113 million of pass product revenues and related deferred costs to fiscal 2021 for credits offered to 2019/2020 North American pass product holders; $1.4 million of acquisition and integration-related expenses; approximately $1 million due to unfavorable currency translation related to operations at Whistler Blackcomb and its Australian ski areas.
Resort operating expenses totaled $389.2 million, down 18.5% year over year. Total segmental operating expenses also fell 18.5% year over year to $390.4 million.
Balance Sheet
Cash and cash equivalents as of Apr 30, 2020, totaled $482.7million, up from $59.6 million in the year-ago period.
Net long-term debt amounted to $2,365.4 million at the end of the quarter, up from $1,310.9 million at the end of the prior-year quarter.
As of May 31, 2020, the company had total cash and revolver availability of approximately $1.1 billion. This includes $465 million of cash in hand, $419 million of U.S. revolver availability under the Vail Holdings Credit Agreement and $168 million of revolver availability under the Whistler Credit Agreement.
In April, the company announced plans to boost its liquidity by reducing its capital expenditures for 2020 by approximately $80-$85 million. The company also suspended cash dividends to shareholders for a minimum of two quarters, leading to an additional $142 million of liquidity. Nonetheless, the company stated that it has sufficient liquidity to fund its operations for up to two years, even if resort shutdowns are extended.
Fiscal 2020 Guidance
Although the company expects fourth quarter or fiscal 2020 results to be negatively impacted by lower visitation to its resort properties, it will not be issuing any guidance for the same.
Zacks Rank & Key Picks
Vail Resorts currently carries a Zacks Rank #3 (Hold). You can see the complete list of today’s Zacks #1 Rank (Strong Buy) stocks here.
Some better-ranked stocks in the Zacks Consumer Discretionary sector include BJ's Wholesale Club Holdings, Inc. BJ, Capcom Co., Ltd. CCOEY and Camping World Holdings, Inc. CWH. BJ's Wholesale Club and Capcom sport a Zacks Rank #1, while Camping World Holdings carries a Zacks Rank #2 (Buy).
BJ's Wholesale Club has an expected three-five year earnings per share growth rate of 13.6%.
Earnings in 2020 for Capcom and Camping World Holdings are expected to surge 29.6% and 193.9%, respectively.
Today's Best Stocks from Zacks
Would you like to see the updated picks from our best market-beating strategies? From 2017 through 2019, while the S&P 500 gained and impressive +53.6%, five of our strategies returned +65.8%, +97.1%, +118.0%, +175.7% and even +186.7%.
This outperformance has not just been a recent phenomenon. From 2000 – 2019, while the S&P averaged +6.0% per year, our top strategies averaged up to +54.7% per year.
See their latest picks free >>
Want the latest recommendations from Zacks Investment Research? Today, you can download 7 Best Stocks for the Next 30 Days. Click to get this free report
BJs Wholesale Club Holdings, Inc. (BJ) : Free Stock Analysis Report
Camping World Holdings Inc. (CWH) : Free Stock Analysis Report
Vail Resorts, Inc. (MTN) : Free Stock Analysis Report
Capcom Co., Ltd. (CCOEY) : Free Stock Analysis Report
To read this article on Zacks.com click here.
