
 Yahoo Finance
 USDCAD defends the long-term up trendline
Last week was great for the USD. Dollar Index made new long-term highs and the EURUSD broke important supports. On almost all instruments with the USD, we can find interesting setups. Today, we present you the USDCAD, where the buy signal is still relatively fresh.
It seems like this pair is coming back to the uptrend, after being in a deeper correction since the end of June. Our positive view on the USDCAD is based on the few factors. First one is the long-term up trendline, which supports higher lows and highs since the beginning of February (green). At the beginning of August, the price bounced again, which confirms the uptrend in 2018. The second factor is the flag (blue lines). This is a trend continuation pattern, so we should see the breakout of the upper line soon. Last but not least is the breakout of the horizontal resistance on the 1.31 (red). The price being above that line is a confirmation of the positive sentiment.
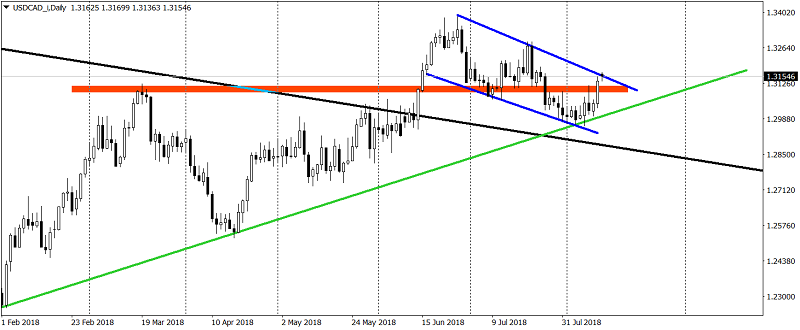
With this setup, in the next few weeks, we should see the further upswing. All we need for a legitimate trigger is the daily candlestick closing above the blue line, which can happen as soon as today.
This article is written by Tomasz Wisniewski, a senior analyst at Alpari Research & Analysis
This article was originally posted on FX Empire
